
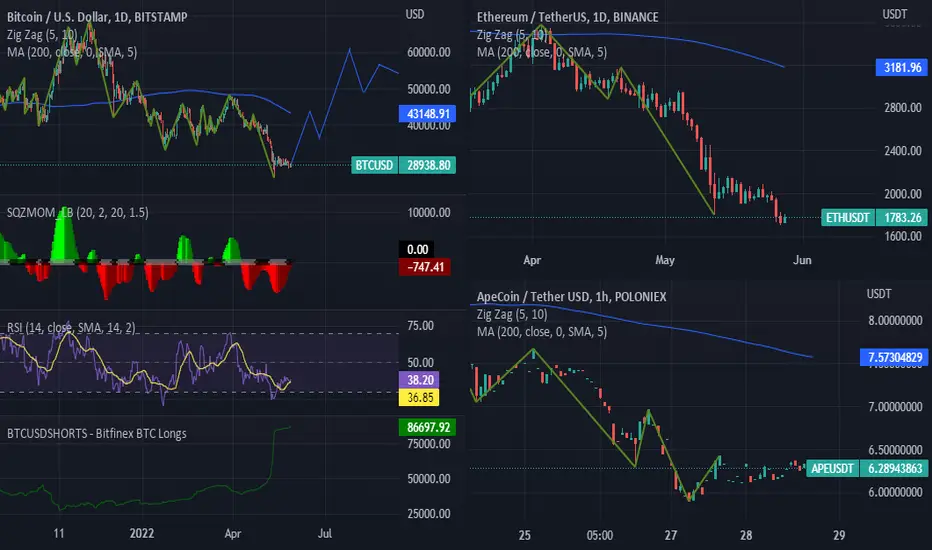
Ethereum and Bitcoin have both hit the lower end of the RSI Indicator. 8 weeks of red and frustration from recent events have created a situation where the new bull market could result in a possible new high. Most interestingly is the Weekly (14) RSI is at a history low indicating the market has exhausted its selling pressure. Targeting 63 RSI on the daily BITCOIN CHART followed by a correction before rocketing the Daily 73-77RSI range.

免责声明
这些信息和出版物并非旨在提供,也不构成TradingView提供或认可的任何形式的财务、投资、交易或其他类型的建议或推荐。请阅读使用条款了解更多信息。
免责声明
这些信息和出版物并非旨在提供,也不构成TradingView提供或认可的任何形式的财务、投资、交易或其他类型的建议或推荐。请阅读使用条款了解更多信息。