
As a comment of my previous idea published this morning,
I wisely pointed out that the neck line of my H&S is more logically on the psychological $7000
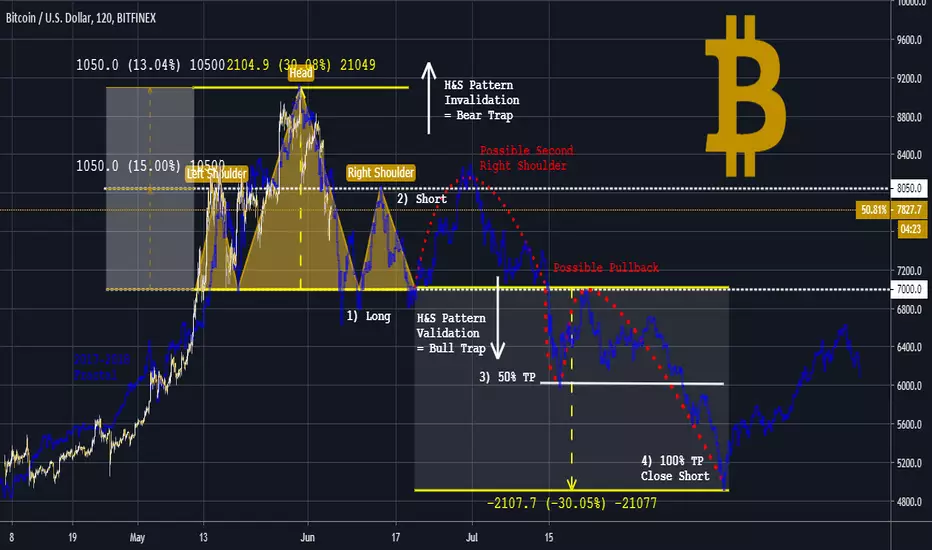
So here is my modified chart, which makes my target even more bearish:
A FIRST LEVEL AT $6000 THEN A SECOND SUB-$5000...
which is much more consistent with my previous analysis elsewhere! (see Related Ideas below)
I also validated this chart with a fractal of the bursting of the 2017 bubble (in blue)
which reminds that a second right shoulder is possible in case the bulls are slow to surrender
I remind you that this is only a hypothesis, certainly very plausible
BUT which requires preliminary intermediate validations as indicated on my chart !
I wisely pointed out that the neck line of my H&S is more logically on the psychological $7000
So here is my modified chart, which makes my target even more bearish:
A FIRST LEVEL AT $6000 THEN A SECOND SUB-$5000...
which is much more consistent with my previous analysis elsewhere! (see Related Ideas below)
I also validated this chart with a fractal of the bursting of the 2017 bubble (in blue)
which reminds that a second right shoulder is possible in case the bulls are slow to surrender
I remind you that this is only a hypothesis, certainly very plausible
BUT which requires preliminary intermediate validations as indicated on my chart !

相关出版物
免责声明
这些信息和出版物并非旨在提供,也不构成TradingView提供或认可的任何形式的财务、投资、交易或其他类型的建议或推荐。请阅读使用条款了解更多信息。