
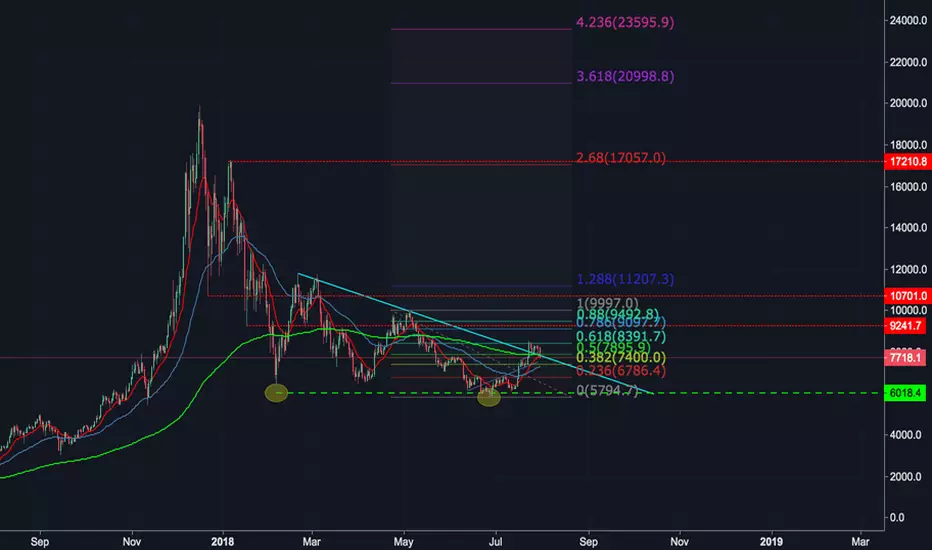
On the HTF we see BTC/USD create significant support zones at the $6,100.00 level. Price respected this support line several times as the lower highs using the $6,100 as a base creates a triangle pattern.
We have already experienced a breakout which got us to the $8,400 levels with a retest and bounced back, using that former resistance trendline as support. However, this bullish activity could simply be a false breakout as we noticed a 5% drop placing BTC under the 0.61 fib zone and minor resistance level of $7,800. We must keep our eye on the close of the daily candle above that zone if we are to expect bullish momentum. Otherwise, we can expect the price to once again test that $6,000 zone again.
Using fibonacci extensions and previously structure as reference points we can create several take profit zones if the candle does close above the triangle pattern once more. The targets are as follows: $9,200 (0.78), $10,100 (1.281), $17,150 (2.68).
We have already experienced a breakout which got us to the $8,400 levels with a retest and bounced back, using that former resistance trendline as support. However, this bullish activity could simply be a false breakout as we noticed a 5% drop placing BTC under the 0.61 fib zone and minor resistance level of $7,800. We must keep our eye on the close of the daily candle above that zone if we are to expect bullish momentum. Otherwise, we can expect the price to once again test that $6,000 zone again.
Using fibonacci extensions and previously structure as reference points we can create several take profit zones if the candle does close above the triangle pattern once more. The targets are as follows: $9,200 (0.78), $10,100 (1.281), $17,150 (2.68).

免责声明
这些信息和出版物并非旨在提供,也不构成TradingView提供或认可的任何形式的财务、投资、交易或其他类型的建议或推荐。请阅读使用条款了解更多信息。