
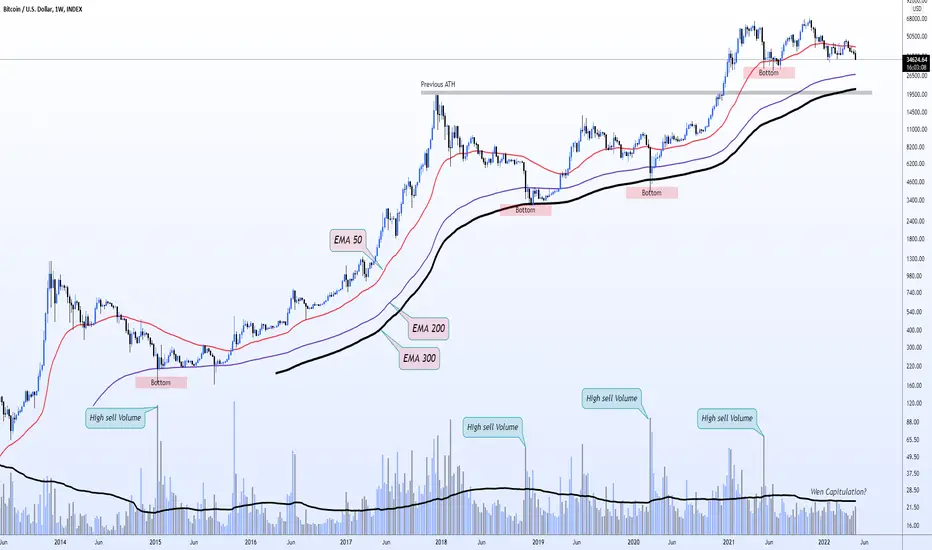
Bitcoin / Weekly / Log Chart
Bitcoin is supported by the 50,200,300 EMA Lines for the past many years. Whenever BTC Bottoms, We see a huge capitulation candle with high sell volume. This means many bulls gave up and they sold all their Bitcoins at the bottom. Later, We saw recovery and saw new ATHs From there.
Currently, We last saw a Capitulation at 29k Last year.
Now since BTC Lost the 50EMA, The price is slowly getting gravitated towards the 200EMA. if we break 29k, Our next support will be 27k. And the worst case will be 20k.
If in case if i see a capitulation candle when we slowly go downwards, That will be the point where i will buy multiple coins heavily.

免责声明
这些信息和出版物并非旨在提供,也不构成TradingView提供或认可的任何形式的财务、投资、交易或其他类型的建议或推荐。请阅读使用条款了解更多信息。