I'm not trading  BTCUSD or cryptos actively but "a chart is a chart" as my my master (he's called MightyOne) says.
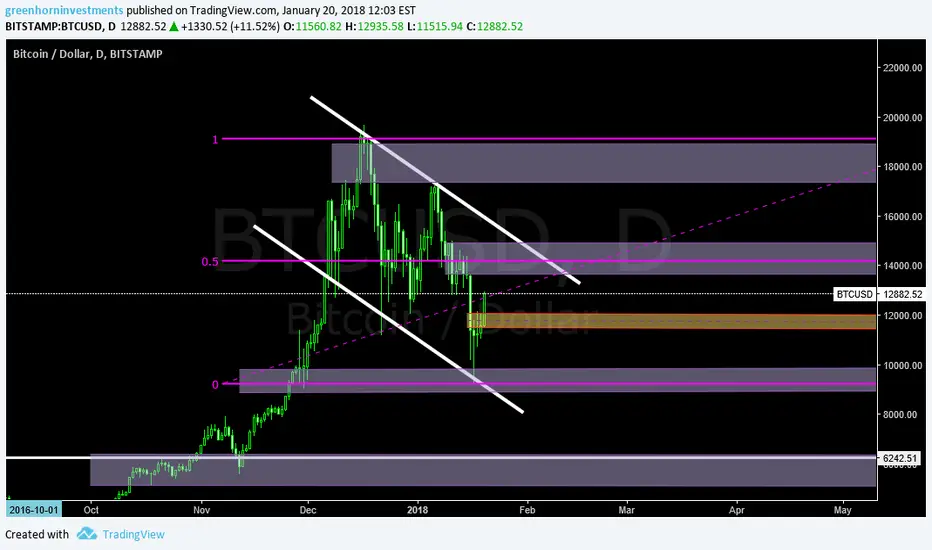
This is how i draw price levels (Supply&Demand) over my charts:
1) Supply is a zone (it doesn't matter how you are drawing it) around the top aka 0% or 25% RET in this chart.
2) Demand is a zone (it doesn't matter how you are drawing it) around the bottom aka 100% or 75% RET in this chart.
3) The midpoint is the midpoint LOL! Use it to take profits or to push in your direction when price is moving away from the actual range.
BTCUSD or cryptos actively but "a chart is a chart" as my my master (he's called MightyOne) says.This is how i draw price levels (Supply&Demand) over my charts:
1) Supply is a zone (it doesn't matter how you are drawing it) around the top aka 0% or 25% RET in this chart.
2) Demand is a zone (it doesn't matter how you are drawing it) around the bottom aka 100% or 75% RET in this chart.
3) The midpoint is the midpoint LOL! Use it to take profits or to push in your direction when price is moving away from the actual range.

免责声明
这些信息和出版物并非旨在提供,也不构成TradingView提供或认可的任何形式的财务、投资、交易或其他类型的建议或推荐。请阅读使用条款了解更多信息。
免责声明
这些信息和出版物并非旨在提供,也不构成TradingView提供或认可的任何形式的财务、投资、交易或其他类型的建议或推荐。请阅读使用条款了解更多信息。