
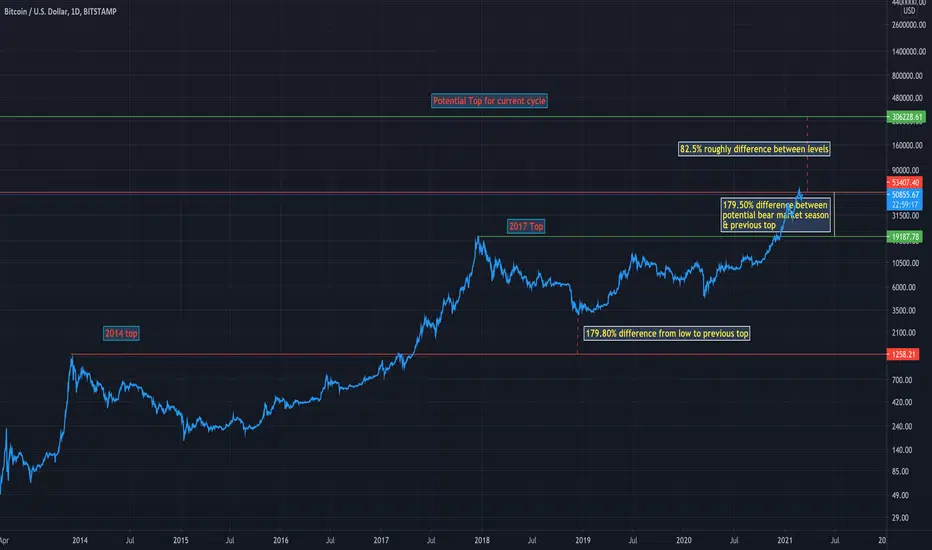
This chart has been drawn out by looking at the 2014 and 2017 tops and looking at the % difference between the 2017 LOWS comparing to the 2014 top.
Taking this difference, we can say from 2017 top we have a potential LOW for where we should be sitting at for a bear season low.
From there we can say the rally between 2014 and 2017 was 1400% which puts us roughly at $306,000. Calculating the down side in the 2017 bear season, it fell roughly 87%, if we are saying $306,000 is the top, then 85% retracement would put us roughly in the $42k BTC range.
Taking this difference, we can say from 2017 top we have a potential LOW for where we should be sitting at for a bear season low.
From there we can say the rally between 2014 and 2017 was 1400% which puts us roughly at $306,000. Calculating the down side in the 2017 bear season, it fell roughly 87%, if we are saying $306,000 is the top, then 85% retracement would put us roughly in the $42k BTC range.

免责声明
这些信息和出版物并非旨在提供,也不构成TradingView提供或认可的任何形式的财务、投资、交易或其他类型的建议或推荐。请阅读使用条款了解更多信息。
免责声明
这些信息和出版物并非旨在提供,也不构成TradingView提供或认可的任何形式的财务、投资、交易或其他类型的建议或推荐。请阅读使用条款了解更多信息。