
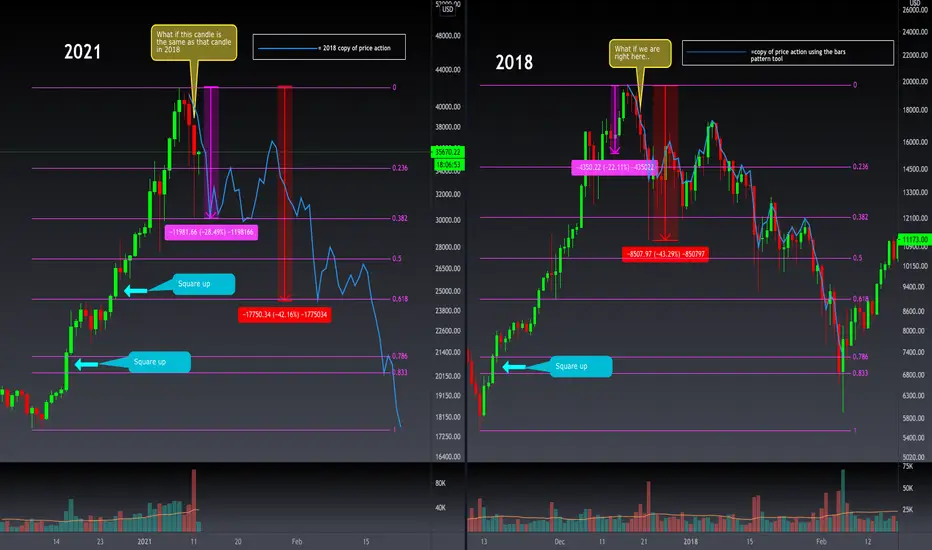
This is a possible scenario.
I enjoy seeing patterns play out over time. I think that the top might be in and we can compare our current position to the same spot in 2018.
I used the bars pattern tool to copy the exact price action from the first wave down after the 2017 top, then pasted it to our current position.
I find it interesting that it even lines up well with my fib retracements of this local swing.
What do you think?
Is the top in?
I enjoy seeing patterns play out over time. I think that the top might be in and we can compare our current position to the same spot in 2018.
I used the bars pattern tool to copy the exact price action from the first wave down after the 2017 top, then pasted it to our current position.
I find it interesting that it even lines up well with my fib retracements of this local swing.
What do you think?
Is the top in?
注释
I still believe the top is in.Still playing out rather similar. I do think there is a possibility that we come off my .50 fib and exhaust back up. I would look for 34-36k as resistance. If that holds as resistance. We will see 20k quickly.
Stay tuned.
More updates to come.
注释
Updating this! Well, it certainly started off very similar. But this has now been invalidated.

thetradeschool.net/courses/placement-exam-fast-start-to-trading/ -College Level courses I dare you to take the pretest! See what u know free!
Reach out for a discount code for our beginner course!
Reach out for a discount code for our beginner course!
免责声明
这些信息和出版物并非旨在提供,也不构成TradingView提供或认可的任何形式的财务、投资、交易或其他类型的建议或推荐。请阅读使用条款了解更多信息。
thetradeschool.net/courses/placement-exam-fast-start-to-trading/ -College Level courses I dare you to take the pretest! See what u know free!
Reach out for a discount code for our beginner course!
Reach out for a discount code for our beginner course!
免责声明
这些信息和出版物并非旨在提供,也不构成TradingView提供或认可的任何形式的财务、投资、交易或其他类型的建议或推荐。请阅读使用条款了解更多信息。