
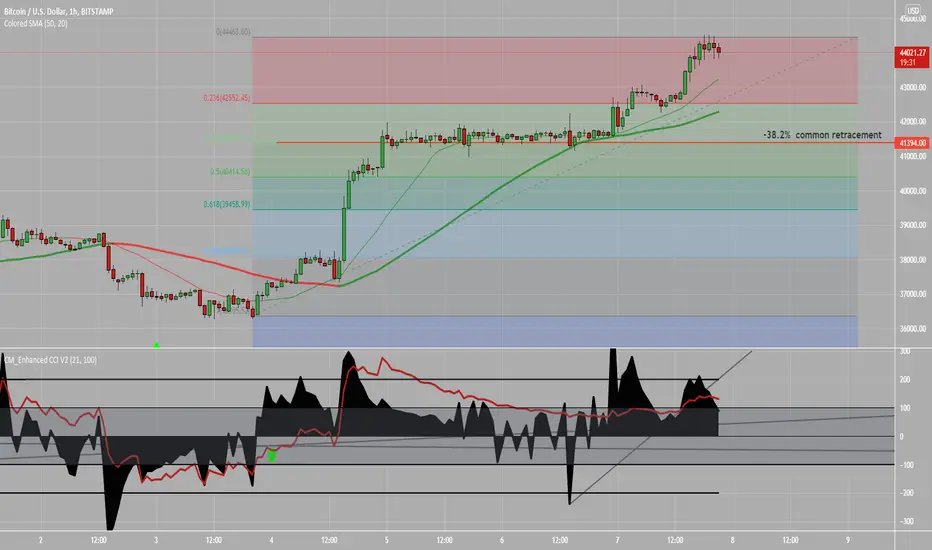
Here's an hourly chart recommended on the previous Daily chart post for scalping of a likely pullback. As explained there, we were looking on H1 chart for a break of 13CCI down thru an uptrendline, shown here on chart, from 44315.
Resumption of Up trend would be a cross of CCI back up thru a down trendline on CCI, after tagging -38.2% retracement
Resumption of Up trend would be a cross of CCI back up thru a down trendline on CCI, after tagging -38.2% retracement
注释
It's reasonable to stay w Daily charts if you don't want to trade often注释
sorry I didnt wait for a 5th waveup to 45625 before locating -38.2%.

免责声明
这些信息和出版物并非旨在提供,也不构成TradingView提供或认可的任何形式的财务、投资、交易或其他类型的建议或推荐。请阅读使用条款了解更多信息。