
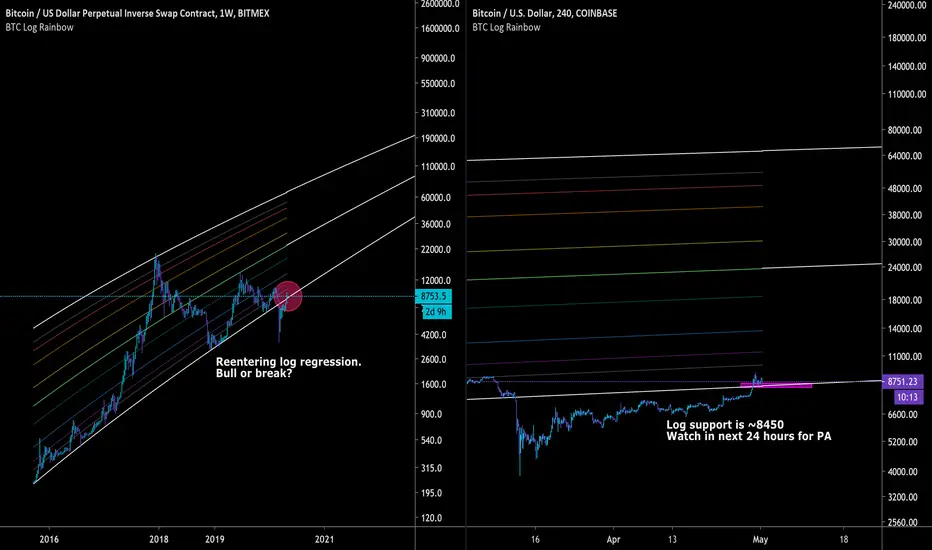
The bottom white curve is the log regression of Bitcoin's price action since its inception. The regression was broken on March 12 when Bitcoin shit itself to the 5000s. Each line in the rainbow of curves represents a fibonacci multiple of the bottom regression line. The regression is multiples are your typical retracements from 0 --> 1 (.236, .382, .5, .618, .786, etc.). The bottom regression line that was broken does not represent the bottom of the retracement, meaning "0." My hunch is that the white line itself is another multiple, such as .236 or .382. As a result, the "invalidation" of the regression in reality was just another movement between fibonacci multiples. I will modify the script at some point to reflect this.
As for the ensuing price action, watch from May 1-2 if it tests the white regression line as support, or it breaks and retests a lower multiple that is invisible at the moment. If price breaks below ~8450 in the next 24 hours, I am shorting hard over the next few weeks.
As for the ensuing price action, watch from May 1-2 if it tests the white regression line as support, or it breaks and retests a lower multiple that is invisible at the moment. If price breaks below ~8450 in the next 24 hours, I am shorting hard over the next few weeks.

免责声明
这些信息和出版物并非旨在提供,也不构成TradingView提供或认可的任何形式的财务、投资、交易或其他类型的建议或推荐。请阅读使用条款了解更多信息。