
Overview:
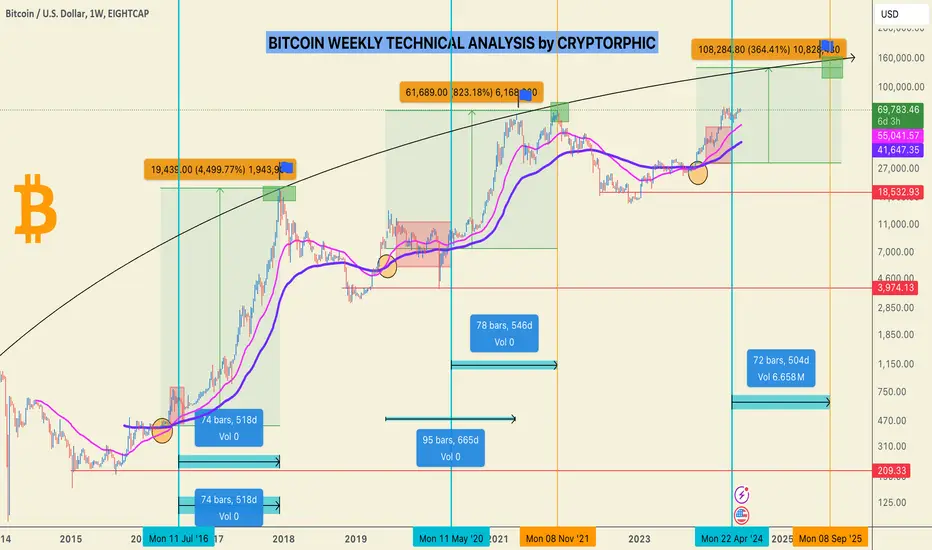
This analysis looks at the historical and projected price movements of Bitcoin (BTC/USD) on a weekly chart.
Historical Price Movements:
1. First Major Rally (2016-2017):
- Growth: 4,499.77%
- Price Increase: From ~$430 to $19,439
- Duration: 86 bars (602 days)
2. Second Major Rally (2020-2021):
- Growth: 1681.18%
- Price Increase: From ~$3924 to $69,889
- Duration: 95 bars (665 days)
Current Trends:
- Current Price: $70,004.70
- Support Levels: $44,532,$52086, $60200, $68300 (Immediate support)
- Resistance Levels: $73,000.00 (immediate), $138,000-$155,000 (projected)
Moving Averages:
- Purple Line: 20-week moving average
- Pink Line: 50-week moving average
Future Projections:
- Potential Target: $138,000-$155,000
- Critical Date: April 2, 2024
- Trend Analysis: Watch for a breakout above $75,000.
Conclusion:
Bitcoin shows strong bullish trends. A breakout above $73,000 could signal another major rally. Monitor the 20-week and 50-week moving averages for trend confirmation.
Simple maths, Fractals and all the data from indicators suggest Bitcoin is poised to hit $100k+ by EOY.
SO AVOID THE NOISE, LOOK AT THE BIGGER PICTURE!
Disclaimer:
This is for informational purposes only and not financial advice. Conduct your own research before investing.
Please hit the like button if you like it and share your views in the comment section.
Thank you
#PEACE
This analysis looks at the historical and projected price movements of Bitcoin (BTC/USD) on a weekly chart.
Historical Price Movements:
1. First Major Rally (2016-2017):
- Growth: 4,499.77%
- Price Increase: From ~$430 to $19,439
- Duration: 86 bars (602 days)
2. Second Major Rally (2020-2021):
- Growth: 1681.18%
- Price Increase: From ~$3924 to $69,889
- Duration: 95 bars (665 days)
Current Trends:
- Current Price: $70,004.70
- Support Levels: $44,532,$52086, $60200, $68300 (Immediate support)
- Resistance Levels: $73,000.00 (immediate), $138,000-$155,000 (projected)
Moving Averages:
- Purple Line: 20-week moving average
- Pink Line: 50-week moving average
Future Projections:
- Potential Target: $138,000-$155,000
- Critical Date: April 2, 2024
- Trend Analysis: Watch for a breakout above $75,000.
Conclusion:
Bitcoin shows strong bullish trends. A breakout above $73,000 could signal another major rally. Monitor the 20-week and 50-week moving averages for trend confirmation.
Simple maths, Fractals and all the data from indicators suggest Bitcoin is poised to hit $100k+ by EOY.
SO AVOID THE NOISE, LOOK AT THE BIGGER PICTURE!
Disclaimer:
This is for informational purposes only and not financial advice. Conduct your own research before investing.
Please hit the like button if you like it and share your views in the comment section.
Thank you
#PEACE

Daily Signals:- telegram.me/thecryptorphic
My Fav BITUNIX: bitunix.com/register?vipCode=Cryptorphic
Weex $2000: bit.ly/Weex2026
ELITES: bit.ly/Join_elite
My Fav BITUNIX: bitunix.com/register?vipCode=Cryptorphic
Weex $2000: bit.ly/Weex2026
ELITES: bit.ly/Join_elite
相关出版物
免责声明
这些信息和出版物并非旨在提供,也不构成TradingView提供或认可的任何形式的财务、投资、交易或其他类型的建议或推荐。请阅读使用条款了解更多信息。
Daily Signals:- telegram.me/thecryptorphic
My Fav BITUNIX: bitunix.com/register?vipCode=Cryptorphic
Weex $2000: bit.ly/Weex2026
ELITES: bit.ly/Join_elite
My Fav BITUNIX: bitunix.com/register?vipCode=Cryptorphic
Weex $2000: bit.ly/Weex2026
ELITES: bit.ly/Join_elite
相关出版物
免责声明
这些信息和出版物并非旨在提供,也不构成TradingView提供或认可的任何形式的财务、投资、交易或其他类型的建议或推荐。请阅读使用条款了解更多信息。