
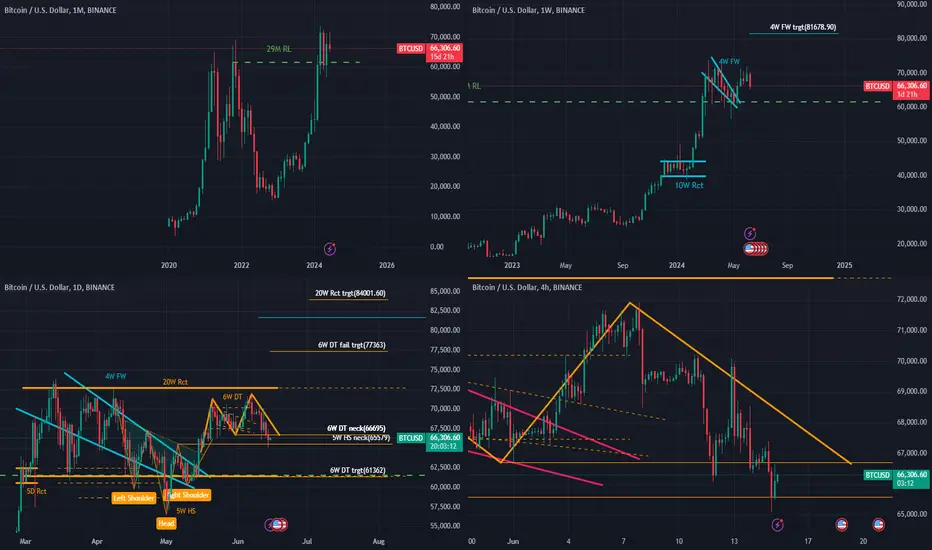
Idea based on Classical chart patterns (Daily Chart).
Abbreviations:
M/W/D/H = Month/Week/Day/Hour
TL: Trendline
DT: Double Top
DTr: Descending Triangle
FW: Falling Wedge
Rct: Rectangle
We are still close to the all time highs, and we have also seen a breakout from a 4W FW on the weekly chart indicating some buying interest left near the relative lows.
When you look at the daily chart, there is a 6W DT which seems to be complete, but the downside breakout bar is with a long wick. And the closing bar was up.
This leads me to suspect this might be a fake breakout. Support is seen close to where we saw the 4W FW pattern completed, with levels close to the last bar acting as key bar to watch. Also, we can see the current market as inside a 20W Rct pattern and we are right around the middle of the box.
if the 6W DT fails the first target will be @ 77363, if completed, the target will become the 4W FW target @ 81678.90, and ultimately 20W Rct target @ 84001.60
the problem with this trade is that we still don't have a confirmation of a failure, so i need to place the stop loss at lows level within the formation of this DT pattern which is May16th low @ 64548, being fully aware that this trade might be one that could cause me to enter multiple times.
Risk reward calculated against capital using the first target is
Entry : 66330 or below
SL : 64548 (-0.73%) / TP: 77363(+4.50%)
RR: Apprx. 6:1
(as always, not investment advise or prediction)
Abbreviations:
M/W/D/H = Month/Week/Day/Hour
TL: Trendline
DT: Double Top
DTr: Descending Triangle
FW: Falling Wedge
Rct: Rectangle
We are still close to the all time highs, and we have also seen a breakout from a 4W FW on the weekly chart indicating some buying interest left near the relative lows.
When you look at the daily chart, there is a 6W DT which seems to be complete, but the downside breakout bar is with a long wick. And the closing bar was up.
This leads me to suspect this might be a fake breakout. Support is seen close to where we saw the 4W FW pattern completed, with levels close to the last bar acting as key bar to watch. Also, we can see the current market as inside a 20W Rct pattern and we are right around the middle of the box.
if the 6W DT fails the first target will be @ 77363, if completed, the target will become the 4W FW target @ 81678.90, and ultimately 20W Rct target @ 84001.60
the problem with this trade is that we still don't have a confirmation of a failure, so i need to place the stop loss at lows level within the formation of this DT pattern which is May16th low @ 64548, being fully aware that this trade might be one that could cause me to enter multiple times.
Risk reward calculated against capital using the first target is
Entry : 66330 or below
SL : 64548 (-0.73%) / TP: 77363(+4.50%)
RR: Apprx. 6:1
(as always, not investment advise or prediction)
交易结束:到达止损
: ( now the chart pattern has confirmed a breakout to the downside. might consider reentry as a short trade.
交易结束:到达止损
the result is -0.7% loss (based on total assets)
免责声明
这些信息和出版物并非旨在提供,也不构成TradingView提供或认可的任何形式的财务、投资、交易或其他类型的建议或推荐。请阅读使用条款了解更多信息。
免责声明
这些信息和出版物并非旨在提供,也不构成TradingView提供或认可的任何形式的财务、投资、交易或其他类型的建议或推荐。请阅读使用条款了解更多信息。