
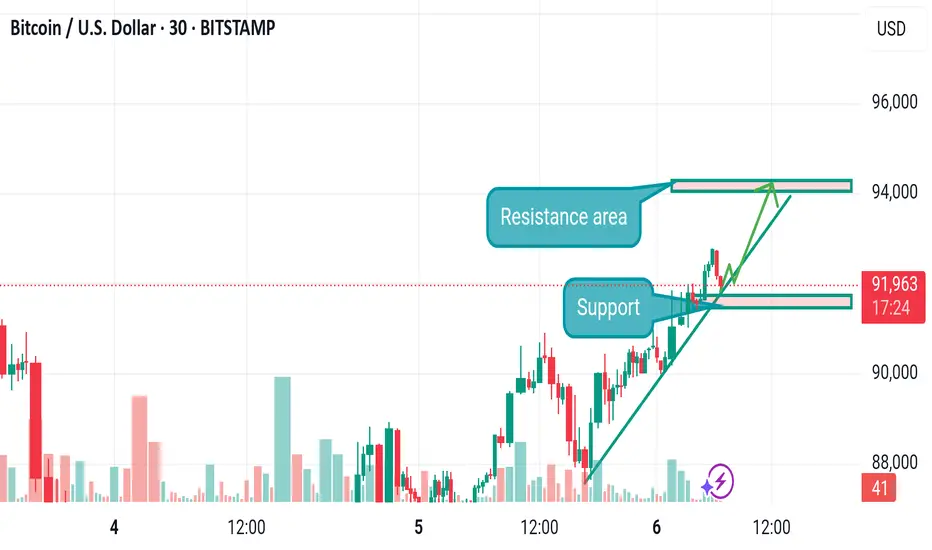
Bitcoin Price Trend Analysis (30-Min Chart)
Current Price: 92,005 USD
1. Key Levels & Distances
Resistance Zone: 94,000 USD (+1,995 USD from current price)
Support Zone: 91,500 USD (-505 USD from current price)
Major Support: 90,000 USD (-2,005 USD from current price)
2. Trend Analysis & Possible Scenarios
Bullish Scenario (Uptrend)
If the price maintains support above 91,500 USD and breaks 94,000 USD, it could push higher toward 95,000 USD or more.
Confirmation of higher highs and higher lows will strengthen bullish momentum.
Bearish Scenario (Downtrend)
If the price fails to break 94,000 USD and drops below 91,500 USD, a correction towards 90,000 USD is possible.
Breaking below 90,000 USD could indicate a larger downtrend.
---
3. Trading Strategy Insights
For Buyers (Long Positions):
Look for a breakout above 94,000 USD before entering.
A stop-loss around 91,500 USD.
Target profit at 95,000+ USD.
For Sellers (Short Positions):
If price rejects 94,000 USD, short entries below 91,500 USD could be considered.
Stop-loss near 92,500 USD.
Profit target around 90,000 USD.
Current Price: 92,005 USD
1. Key Levels & Distances
Resistance Zone: 94,000 USD (+1,995 USD from current price)
Support Zone: 91,500 USD (-505 USD from current price)
Major Support: 90,000 USD (-2,005 USD from current price)
2. Trend Analysis & Possible Scenarios
Bullish Scenario (Uptrend)
If the price maintains support above 91,500 USD and breaks 94,000 USD, it could push higher toward 95,000 USD or more.
Confirmation of higher highs and higher lows will strengthen bullish momentum.
Bearish Scenario (Downtrend)
If the price fails to break 94,000 USD and drops below 91,500 USD, a correction towards 90,000 USD is possible.
Breaking below 90,000 USD could indicate a larger downtrend.
---
3. Trading Strategy Insights
For Buyers (Long Positions):
Look for a breakout above 94,000 USD before entering.
A stop-loss around 91,500 USD.
Target profit at 95,000+ USD.
For Sellers (Short Positions):
If price rejects 94,000 USD, short entries below 91,500 USD could be considered.
Stop-loss near 92,500 USD.
Profit target around 90,000 USD.

免责声明
这些信息和出版物并非旨在提供,也不构成TradingView提供或认可的任何形式的财务、投资、交易或其他类型的建议或推荐。请阅读使用条款了解更多信息。
免责声明
这些信息和出版物并非旨在提供,也不构成TradingView提供或认可的任何形式的财务、投资、交易或其他类型的建议或推荐。请阅读使用条款了解更多信息。