
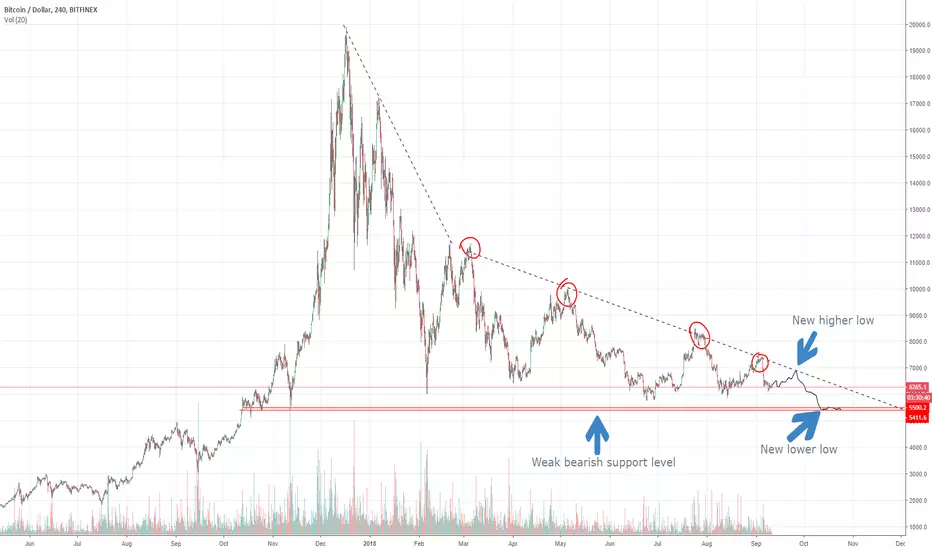
This is a visualisation on bitcoins next move.
As we see, we have formed 4 consecutive higher lows on a longer time span. Im positive this pattern will repeat again. U can see on my drawing, what I visualize will happen.
When we will hit a higher low, close end to september, a bearish sentiment is in, for hitting a new lower low. Putting bitcoin at a realistic support area of 5500 to 5400. Or maybe even slightly lower, the typical nature of bitcoin is to spike a lot lower or higher than expected.
Please let me hear your thoughts
Have a nice day Mr. Project :)
As we see, we have formed 4 consecutive higher lows on a longer time span. Im positive this pattern will repeat again. U can see on my drawing, what I visualize will happen.
When we will hit a higher low, close end to september, a bearish sentiment is in, for hitting a new lower low. Putting bitcoin at a realistic support area of 5500 to 5400. Or maybe even slightly lower, the typical nature of bitcoin is to spike a lot lower or higher than expected.
Please let me hear your thoughts
Have a nice day Mr. Project :)
注释
..注释
The 4 "higher lows" are ofc "lower highs".
免责声明
这些信息和出版物并非旨在提供,也不构成TradingView提供或认可的任何形式的财务、投资、交易或其他类型的建议或推荐。请阅读使用条款了解更多信息。
免责声明
这些信息和出版物并非旨在提供,也不构成TradingView提供或认可的任何形式的财务、投资、交易或其他类型的建议或推荐。请阅读使用条款了解更多信息。