
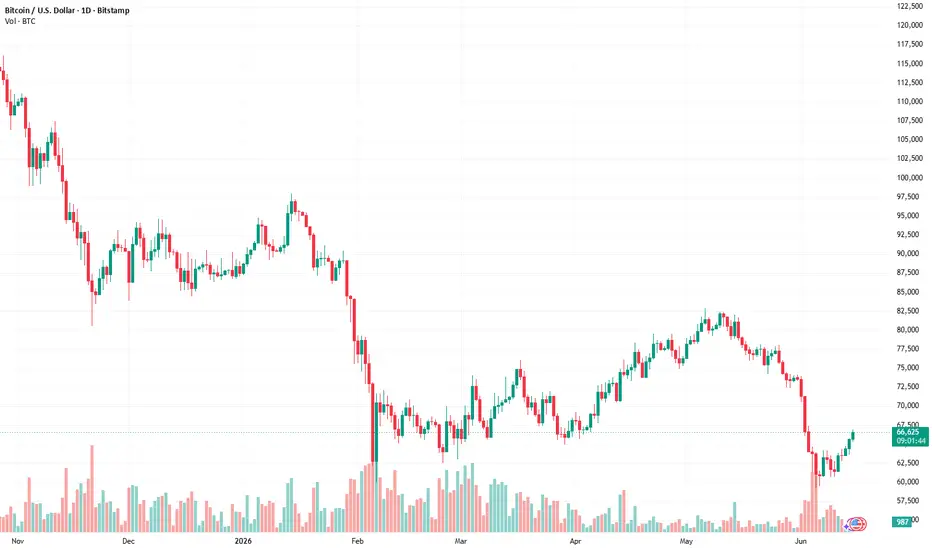
Technical analysis is a way of studying price movement on a chart. Instead of focusing only on company news or economic reports, technical analysts look at price, volume, trends, and chart patterns. Their goal is not to predict the future with certainty. Their goal is to understand where buyers and sellers may become active.
One of the main reasons traders study patterns is to find possible entry and exit points. An entry point is the price area where a trader considers opening a trade. An exit point is the price area where a trader considers closing a trade, either to take profit or to reduce a loss.
Chart patterns can help because they show how price behaves over time. When price keeps reacting to the same support or resistance area, it tells traders that this level is important. Support is an area where price has often stopped falling. Resistance is an area where price has often stopped rising. Many entry and exit ideas begin with these two simple concepts.
For example, if price is moving upward and then pulls back to a support area, some traders may watch for signs that buyers are stepping in again. If price starts to rise from that area, they may see it as a possible entry point. The pattern gives them a reason to pay attention, but they usually wait for confirmation before acting.
A breakout is another common pattern-based entry idea. A breakout happens when price moves above resistance or below support. If price has been moving sideways for some time, a strong breakout can suggest that the market is choosing a new direction. Technical analysts often watch whether the breakout is supported by strong volume. Higher volume can show that more traders are taking part in the move.
Patterns such as triangles, flags, and rectangles are often used in this way. A triangle shows that price is getting squeezed into a smaller range. A flag shows a short pause after a strong move. A rectangle shows that price is moving between clear support and resistance levels. In each case, traders are watching for price to leave the pattern and continue with strength.
Entry points are not only about getting into a trade early. They are also about finding a place where the risk can be managed. A trader may enter after a breakout, but they may also decide in advance where the trade idea becomes invalid. For example, if price breaks above resistance and then falls back below it, the breakout may have failed. This area can help the trader decide where to place a stop-loss.
Exit points work in a similar way. Technical analysts often use previous highs, previous lows, trendlines, or measured moves to plan exits. If a trader buys near support, they may look at the next resistance area as a possible profit target. If a trader sells after a bearish breakdown, they may watch the next support area as a possible place to close the trade.
Some patterns also give traders a rough idea of possible price targets. For example, in a rectangle pattern, traders may measure the height of the range and project it from the breakout point. This does not guarantee that price will reach the target. It only gives a structured way to think about reward compared with risk.
Another important part of exit planning is knowing when the pattern is no longer working. A trader may enter because price breaks out of a triangle, but if price quickly returns inside the triangle, that can be a warning sign. In this case, the exit is not based on emotion. It is based on the original trade idea becoming weaker.
Many beginners make the mistake of thinking that patterns are perfect signals. They are not. A head and shoulders pattern can fail. A triangle can break in one direction and then reverse. A flag can turn into a deeper correction. This is why experienced technical analysts do not rely on patterns alone. They often combine patterns with trend direction, volume, support and resistance, and risk management.
The best use of patterns is to create a clear plan. A pattern can help a trader decide where to enter, where to exit, where to place a stop-loss, and whether the possible reward is worth the risk. This makes trading more organized and less emotional.
For beginners, the most important lesson is simple: patterns are tools, not guarantees. They help traders read the market and prepare for possible outcomes. When used carefully, they can make entry and exit decisions clearer, but every trade still needs patience, discipline, and proper risk control.

免责声明
这些信息和出版物并非旨在提供,也不构成TradingView提供或认可的任何形式的财务、投资、交易或其他类型的建议或推荐。请阅读使用条款了解更多信息。
免责声明
这些信息和出版物并非旨在提供,也不构成TradingView提供或认可的任何形式的财务、投资、交易或其他类型的建议或推荐。请阅读使用条款了解更多信息。