
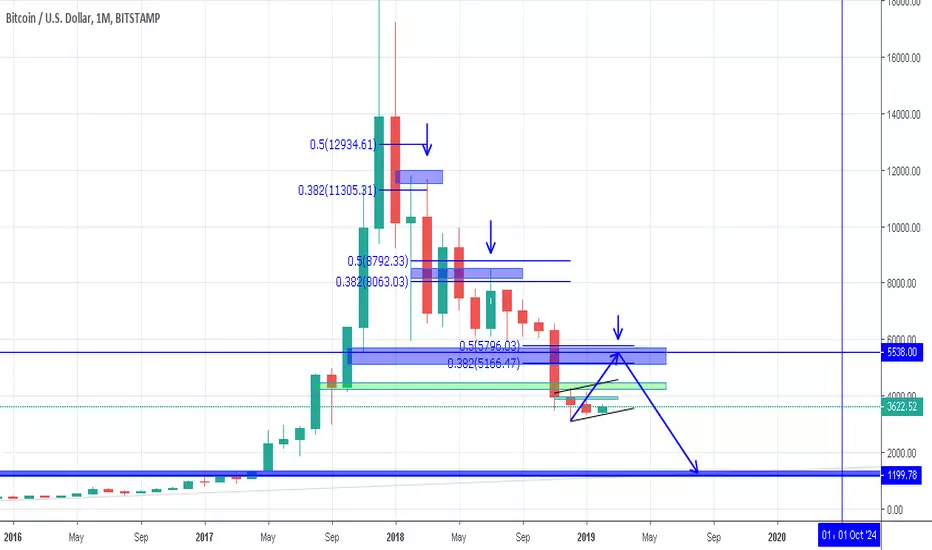
So we have Monthly chart of Bitcoin right here.. It's based on Elliot waves (Left only Fib retracements to make chart look simple).
What I noticed in Bitcoin , it tends to retrace around 0.382-0.5 before resuming trend (which right now is BEARISH ).
Look closely at the fibs, left only 0.382-0.5 for you to see. I'm looking for around 5500 to finish correction up and continue to test our final target of 1200-1400 (Monthly Support).
Also, if you study Bitcoin deeper you can see for example (2013-2015 Bitcoin chart.)
Bull run started at 130, after parabolic move we bottomed out at 154. Look where parabolic trend started and where it ended.. 1000$ is where we started BULL run in March 2017. Bottoming out at 1200$ wouldn't surprise.. We had exact same situation back then!
* In shorted term I expect 4400-4500$ to be strong barrier until we reach ~5500.
Safe trading! :)
What I noticed in Bitcoin , it tends to retrace around 0.382-0.5 before resuming trend (which right now is BEARISH ).
Look closely at the fibs, left only 0.382-0.5 for you to see. I'm looking for around 5500 to finish correction up and continue to test our final target of 1200-1400 (Monthly Support).
Also, if you study Bitcoin deeper you can see for example (2013-2015 Bitcoin chart.)
Bull run started at 130, after parabolic move we bottomed out at 154. Look where parabolic trend started and where it ended.. 1000$ is where we started BULL run in March 2017. Bottoming out at 1200$ wouldn't surprise.. We had exact same situation back then!
* In shorted term I expect 4400-4500$ to be strong barrier until we reach ~5500.
Safe trading! :)

免责声明
这些信息和出版物并非旨在提供,也不构成TradingView提供或认可的任何形式的财务、投资、交易或其他类型的建议或推荐。请阅读使用条款了解更多信息。
免责声明
这些信息和出版物并非旨在提供,也不构成TradingView提供或认可的任何形式的财务、投资、交易或其他类型的建议或推荐。请阅读使用条款了解更多信息。