
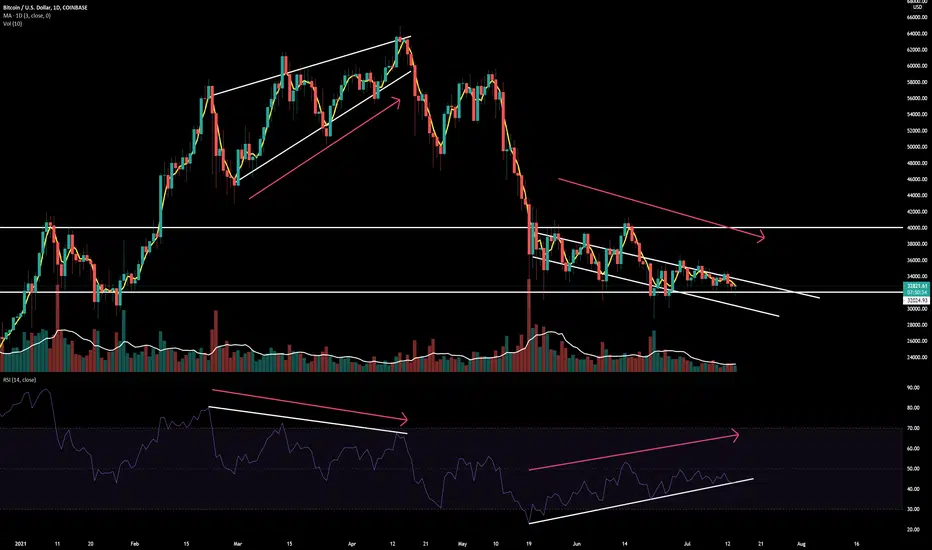
Quick chart showing two recent trends. On the left you see a 3 Day MA BTC price channel trending up while the daily RSI trends down, leading to the May Crypto Crash. On the right you have a 3 Day MA Bitcoin price channel trending down while the RSI trends up. An additional observation is that both trends coincided with waning volumes. Waning volume can indicate tired trends. Combined with the Bollinger Squeeze, Bitcoin seems coiled for a big move. Macro Long, Micro Agnostic. Follow us on twitter at @CoinBumpChart for more insights.

免责声明
这些信息和出版物并非旨在提供,也不构成TradingView提供或认可的任何形式的财务、投资、交易或其他类型的建议或推荐。请阅读使用条款了解更多信息。
免责声明
这些信息和出版物并非旨在提供,也不构成TradingView提供或认可的任何形式的财务、投资、交易或其他类型的建议或推荐。请阅读使用条款了解更多信息。