
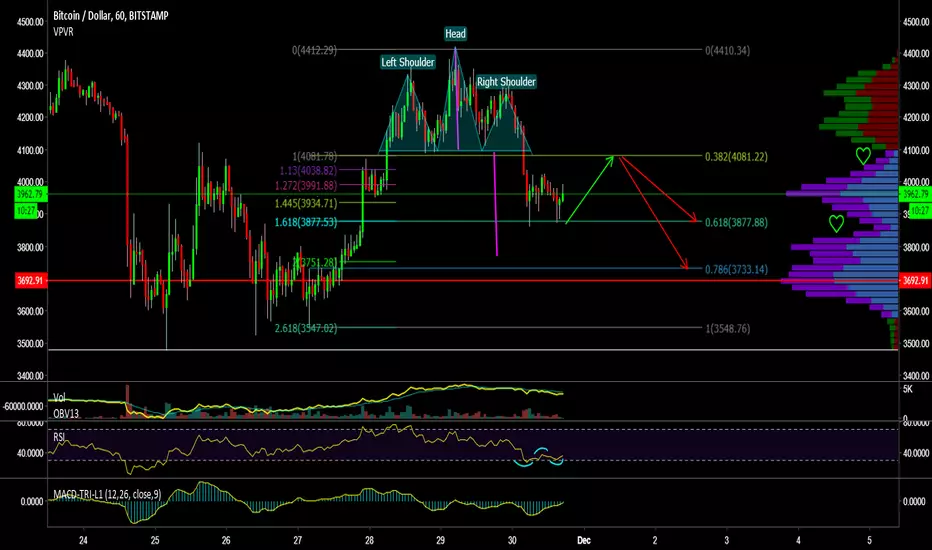
Looking at a study of 1 hour chart of BTCUSD
We've seen the head and shoulders pattern play out but we still haven't the pull back of the distance between the top of the head relative to current price action.
Volume has dropped off significantly
OBV looking to W but imo I think the gap is to big to form a W now
RSI has a nice W and double bottom formed
W%R not quite in the over sold
No real structure to the histogram
VPVR have notches in both the 382 and 618 fib levels
Im looking for a nice stab into the 786 fib and previous candle body lows.
For me there are currently no trade setups for BTC.
I'll watch and wait till the bulls and bears are done finding some sort of floor but for now we will be trading in the range of 3480 and 4640 (rough figures)
We've seen the head and shoulders pattern play out but we still haven't the pull back of the distance between the top of the head relative to current price action.
Volume has dropped off significantly
OBV looking to W but imo I think the gap is to big to form a W now
RSI has a nice W and double bottom formed
W%R not quite in the over sold
No real structure to the histogram
VPVR have notches in both the 382 and 618 fib levels
Im looking for a nice stab into the 786 fib and previous candle body lows.
For me there are currently no trade setups for BTC.
I'll watch and wait till the bulls and bears are done finding some sort of floor but for now we will be trading in the range of 3480 and 4640 (rough figures)

免责声明
这些信息和出版物并非旨在提供,也不构成TradingView提供或认可的任何形式的财务、投资、交易或其他类型的建议或推荐。请阅读使用条款了解更多信息。
免责声明
这些信息和出版物并非旨在提供,也不构成TradingView提供或认可的任何形式的财务、投资、交易或其他类型的建议或推荐。请阅读使用条款了解更多信息。