
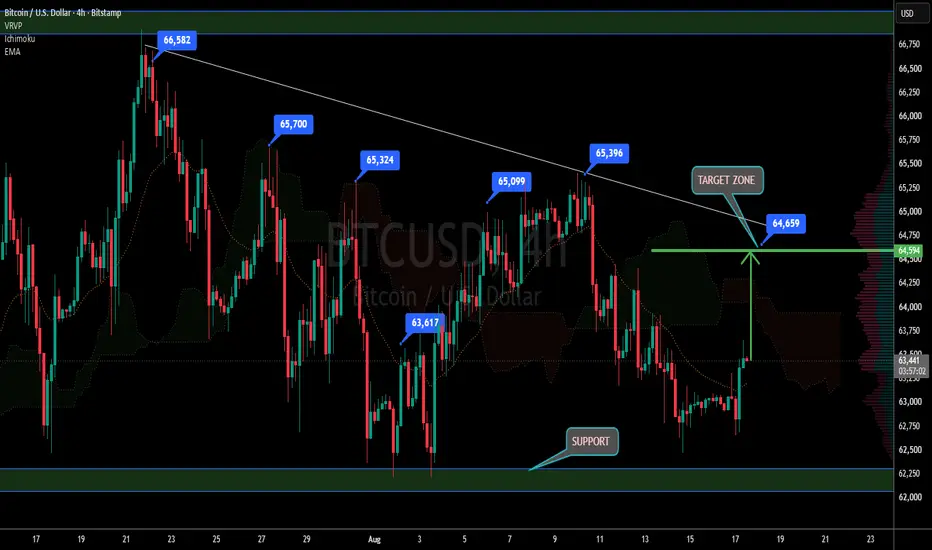
This is the Bitcoin / U.S. Dollar - BTCUSD 4-Hour chart on Bitstamp from TradingView.
Chart Analysis:
1. Range Play: BTC has been moving between a major SUPPORT zone at the bottom and a descending trendline at the top.
2. Previous Swings: Chart marks past highs: $66,588 → $63,700 → $64,114 → $64,999 → $65,344. Each lower high shows sellers were in control.
3. Current Move: After touching support, price bounced hard and is now heading up. Green arrow points to the TARGET ZONE around $64,000.
4. Structure: Still under the downtrend line. A break above it is needed to confirm trend reversal.
Key Levels to Watch:
- Support: Green zone at bottom ∼$60,000 - $60,500. Must hold for bullish case
- Target Zone: $64,000 - First major resistance + confluence with trendline
- Resistance: $65,300 - $66,600 area - Previous swing highs. Break here flips structure bullish
Bias: Bullish short-term while above support. If BTC breaks and closes 4H above $64,000 + trendline, next move is toward $65,300+. Rejection at $64K = pullback to support likely.
Educational only. Not financial advice. BTC is volatile - use SL.
交易开始
active 交易结束:到达目标
target hitt
t.me/+iZwBzq15KTM1Mzc0
join telegram for free signal on gold and different markets
t.me/+iZwBzq15KTM1Mzc0
join free telegram channel
join telegram for free signal on gold and different markets
t.me/+iZwBzq15KTM1Mzc0
join free telegram channel
相关出版物
免责声明
这些信息和出版物并非旨在提供,也不构成TradingView提供或认可的任何形式的财务、投资、交易或其他类型的建议或推荐。请阅读使用条款了解更多信息。
t.me/+iZwBzq15KTM1Mzc0
join telegram for free signal on gold and different markets
t.me/+iZwBzq15KTM1Mzc0
join free telegram channel
join telegram for free signal on gold and different markets
t.me/+iZwBzq15KTM1Mzc0
join free telegram channel
相关出版物
免责声明
这些信息和出版物并非旨在提供,也不构成TradingView提供或认可的任何形式的财务、投资、交易或其他类型的建议或推荐。请阅读使用条款了解更多信息。