
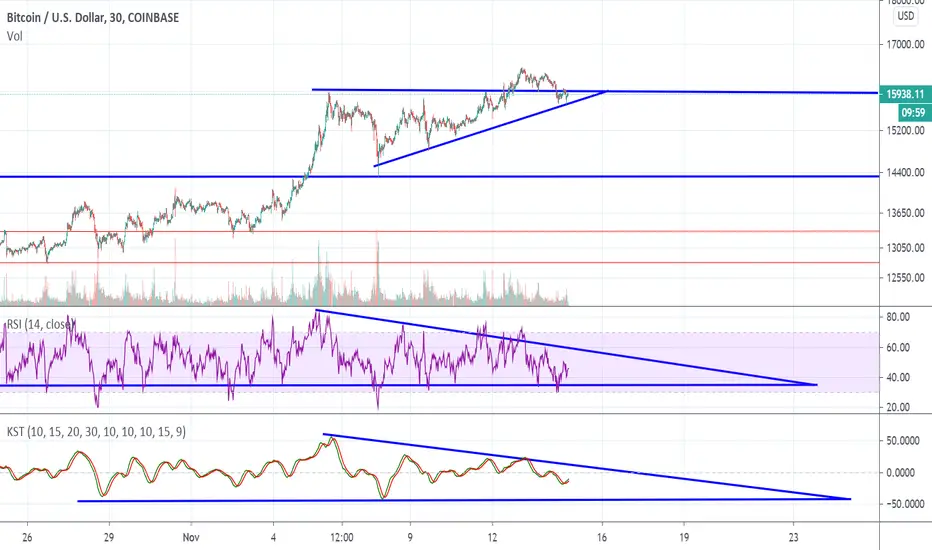
It appears as though Bitcoin has broken out of an Ascending Triangle to the upside, but was quickly rejected back into the pattern forming support on the upward blue sloping line of the Ascending Triangle.
Maybe a fake-out before moving higher, however, at the moment the blue horizontal line of the pattern is acting as resistance instead of turning into support when being back-tested.
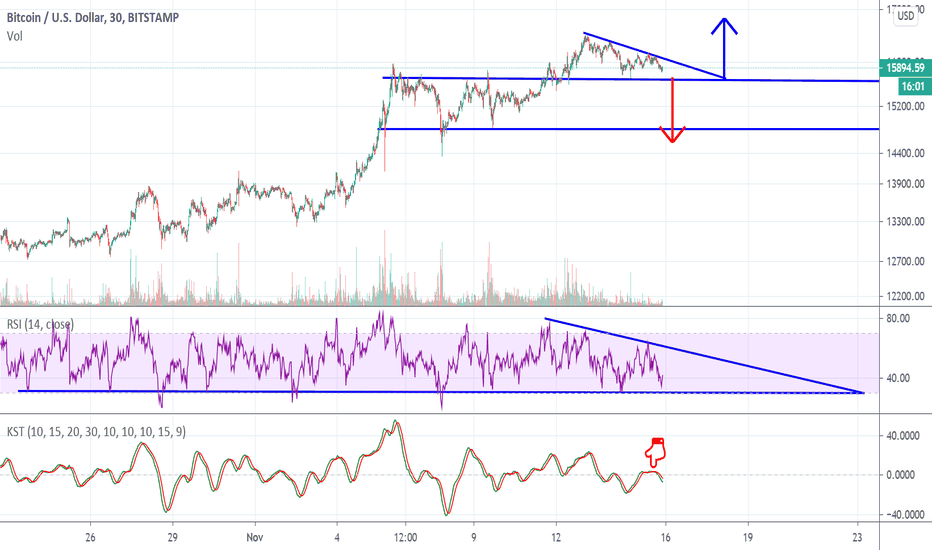
On the RSI there's a descending triangle pattern that I mentioned in my previous post linked to this chart, the blue downward sloping line of resistance has been very consistent, the only divergence outside of the pattern coincides with the price of BTC breaking out of the ascending triangle.
On the KST there's a similar pattern, if we see Bitcoin continue to rise & there's another rejection on the RSI & KST at the blue downward sloping line it could get fugly, time will tell.
Maybe a fake-out before moving higher, however, at the moment the blue horizontal line of the pattern is acting as resistance instead of turning into support when being back-tested.
On the RSI there's a descending triangle pattern that I mentioned in my previous post linked to this chart, the blue downward sloping line of resistance has been very consistent, the only divergence outside of the pattern coincides with the price of BTC breaking out of the ascending triangle.
On the KST there's a similar pattern, if we see Bitcoin continue to rise & there's another rejection on the RSI & KST at the blue downward sloping line it could get fugly, time will tell.
注释

免责声明
这些信息和出版物并非旨在提供,也不构成TradingView提供或认可的任何形式的财务、投资、交易或其他类型的建议或推荐。请阅读使用条款了解更多信息。