
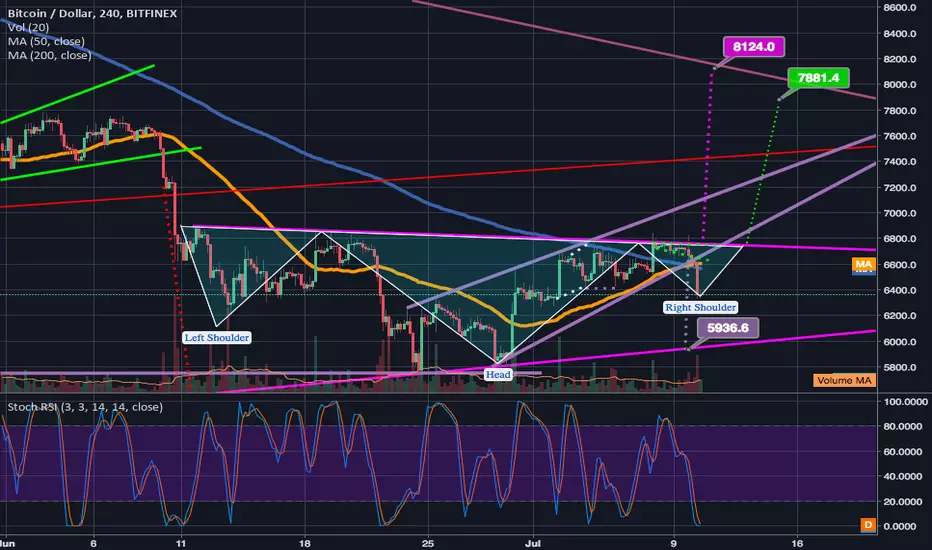
I think it's very likely we can head to 5.9k here. The stochrsi on the 1day chart has plenty of room to drop still and the reason we are currently consolidating I believe is that the 4 hour rsi just hit oversold conditions. So it is likely we will fall back down and retest the bottom trendline of the pink symmetrical triangle. Even though we are currently at a lower low on the 4hr chart...dropping to 5.9k and then bouncing up would actually be a higher low on the 1 day chart. For now I am short. My one hope is that it doesn't cause the golden cross to undo itself. One still potentially bullish outcome to watch for in all of this however is that now we have fallen to a much more symmetrical shoulder height as the first shoulder of the inverted head and shoulder pattern, which means the ivnerted head an shoulder pattern for now is still valid...however it will be invalidated if we continue to fall and retest the bottom trendline of the pink symmetrical triangle pattern. Being prepared for either outcome is my plan...you make your own decision as this is not financial advice. Good luck and thanks for reading!

免责声明
这些信息和出版物并非旨在提供,也不构成TradingView提供或认可的任何形式的财务、投资、交易或其他类型的建议或推荐。请阅读使用条款了解更多信息。
免责声明
这些信息和出版物并非旨在提供,也不构成TradingView提供或认可的任何形式的财务、投资、交易或其他类型的建议或推荐。请阅读使用条款了解更多信息。