
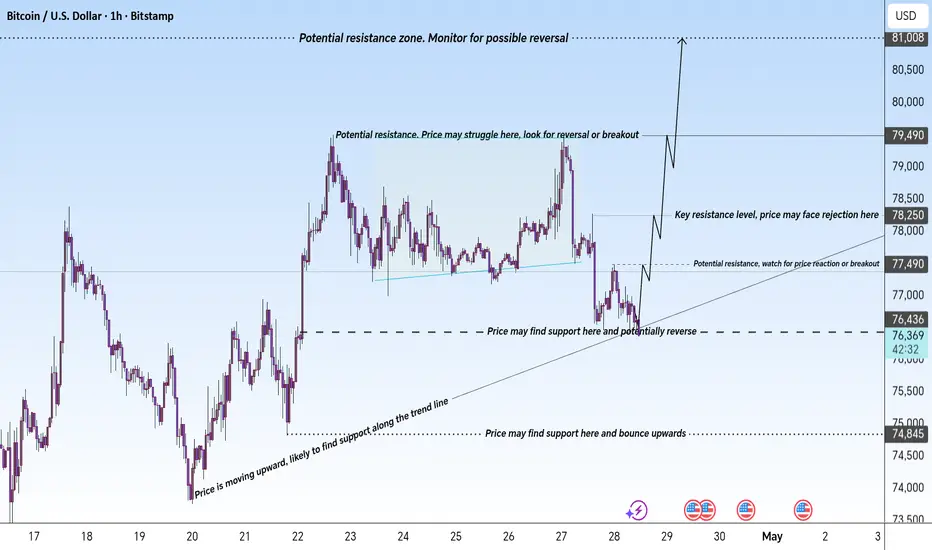
This chart provides a detailed analysis of Bitcoin (BTC/USD), focusing on critical support and resistance levels. The Key Resistance at 78,000 USD is a strong level to monitor for potential rejection or breakout, while 77,000 USD serves as a minor resistance point. On the downside, Support at 74,845 USD and 76,537 USD are key levels where price may find support and reverse upwards
The Upward Trend Line indicates ongoing bullish momentum, suggesting further price movement higher unless disrupted by a breakout or reversal at these levels. Traders should keep a close watch on these levels for potential trading opportunities based on market reactions
The Upward Trend Line indicates ongoing bullish momentum, suggesting further price movement higher unless disrupted by a breakout or reversal at these levels. Traders should keep a close watch on these levels for potential trading opportunities based on market reactions
交易开始
Keep strong hold wait for my last target 🎯 交易结束:到达目标
注释
20% trades hold more
t.me/+HstI692sUGw0ZmRk
✅ MY FREE SIGNALS CHANNEL
✅ PERSONAL TELEGRAM
✅ FOREX BROKER USED
t.me/+pg7FHDH9Zl40MGJk
✅ MY FREE SIGNALS CHANNEL
✅ PERSONAL TELEGRAM
✅ FOREX BROKER USED
t.me/+pg7FHDH9Zl40MGJk
相关出版物
免责声明
这些信息和出版物并非旨在提供,也不构成TradingView提供或认可的任何形式的财务、投资、交易或其他类型的建议或推荐。请阅读使用条款了解更多信息。
t.me/+HstI692sUGw0ZmRk
✅ MY FREE SIGNALS CHANNEL
✅ PERSONAL TELEGRAM
✅ FOREX BROKER USED
t.me/+pg7FHDH9Zl40MGJk
✅ MY FREE SIGNALS CHANNEL
✅ PERSONAL TELEGRAM
✅ FOREX BROKER USED
t.me/+pg7FHDH9Zl40MGJk
相关出版物
免责声明
这些信息和出版物并非旨在提供,也不构成TradingView提供或认可的任何形式的财务、投资、交易或其他类型的建议或推荐。请阅读使用条款了解更多信息。