
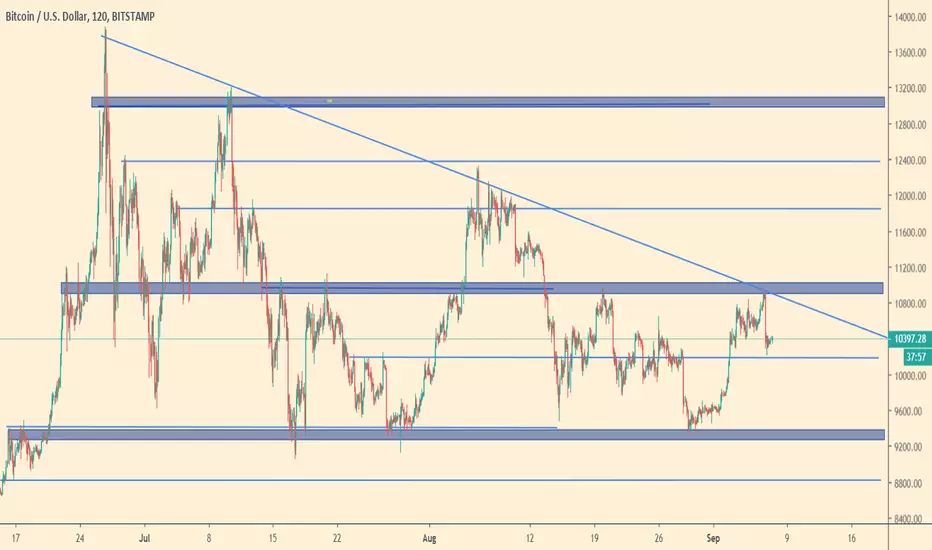
Bitcoin is forming a very large descending triangle, and has been doing it for more than 3 months.
Usually, descending triangles break downwards strongly. This is based on historical data. Now, if we look at the Bitcoin chart, it is very likely to get a larger pullback to $8,500-$8,750 due to the exponential increases had in June.
From The Copilot trading group, we expect the price to test $9,300 during the next week, and to break that evel downwards by the end of September.
Thereafter, there are very large demand zones at lower supports, like $8,700. That might be one of the latest occassions to buy BTC at that price.
Some traders also talk about even larger retracements to $7,000. This might happen, but very likely the demand will reject the price at those levels very quickly by pushing it up. ANd possibly, kicking off the next bull run.
The Copilot
Usually, descending triangles break downwards strongly. This is based on historical data. Now, if we look at the Bitcoin chart, it is very likely to get a larger pullback to $8,500-$8,750 due to the exponential increases had in June.
From The Copilot trading group, we expect the price to test $9,300 during the next week, and to break that evel downwards by the end of September.
Thereafter, there are very large demand zones at lower supports, like $8,700. That might be one of the latest occassions to buy BTC at that price.
Some traders also talk about even larger retracements to $7,000. This might happen, but very likely the demand will reject the price at those levels very quickly by pushing it up. ANd possibly, kicking off the next bull run.
The Copilot

免责声明
这些信息和出版物并非旨在提供,也不构成TradingView提供或认可的任何形式的财务、投资、交易或其他类型的建议或推荐。请阅读使用条款了解更多信息。
免责声明
这些信息和出版物并非旨在提供,也不构成TradingView提供或认可的任何形式的财务、投资、交易或其他类型的建议或推荐。请阅读使用条款了解更多信息。