
Greetings traders,
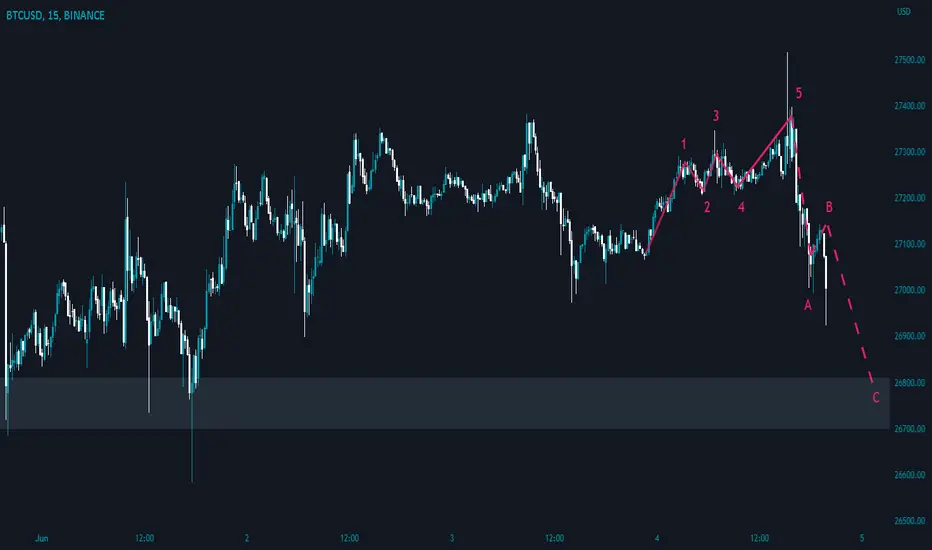
I wanted to share a great example of an Elliott Wave pattern that appears to be playing out on the chart, suggesting a potential trading opportunity.
Elliott Wave Analysis:
The chart reveals a potential 1, 2, 3, 4, 5, A, B, C pattern, which follows the classic Elliott Wave structure. Here's a breakdown of the pattern's key levels:
1. Wave 1: Starting at $27,275, this marks the initial upward wave, signifying the beginning of a potential bullish move.
2. Wave 2: The subsequent pullback from $27,275 led to Location 2 at $27,215, representing a corrective wave.
3. Wave 3: From Location 2, the market continued its upward momentum, surpassing the previous high and reaching Location 3 at $27,300. This wave tends to be the strongest and longest in an impulsive move.
4. Wave 4: After the extended bullish run, a corrective wave followed, retracing to Location 4 at $27,225.
5. Wave 5: The market resumed its upward trajectory, surpassing the previous high and reaching Location 5 at $27,375. This wave often signifies the final push of a bullish move.
6. Wave A: Following the completion of Wave 5, a corrective decline occurred, bringing the price down to Location A at $27,080.
7. Wave B: From Location A, the market staged a rebound, retracing some of the previous decline and reaching Location B at $27,140.
8. Wave C: The pattern suggests that the market is currently heading towards Location C, which aligns with a support level at $26,810. This wave represents the final leg of the corrective pattern. This is a strong level of support but could possibly be broken due to a lack of trading volume during the weekend.
Stay vigilant and monitor the price action closely to see if the pattern continues to unfold as anticipated. Remember to manage your risk effectively and set appropriate stop-loss orders.
I wanted to share a great example of an Elliott Wave pattern that appears to be playing out on the chart, suggesting a potential trading opportunity.
Elliott Wave Analysis:
The chart reveals a potential 1, 2, 3, 4, 5, A, B, C pattern, which follows the classic Elliott Wave structure. Here's a breakdown of the pattern's key levels:
1. Wave 1: Starting at $27,275, this marks the initial upward wave, signifying the beginning of a potential bullish move.
2. Wave 2: The subsequent pullback from $27,275 led to Location 2 at $27,215, representing a corrective wave.
3. Wave 3: From Location 2, the market continued its upward momentum, surpassing the previous high and reaching Location 3 at $27,300. This wave tends to be the strongest and longest in an impulsive move.
4. Wave 4: After the extended bullish run, a corrective wave followed, retracing to Location 4 at $27,225.
5. Wave 5: The market resumed its upward trajectory, surpassing the previous high and reaching Location 5 at $27,375. This wave often signifies the final push of a bullish move.
6. Wave A: Following the completion of Wave 5, a corrective decline occurred, bringing the price down to Location A at $27,080.
7. Wave B: From Location A, the market staged a rebound, retracing some of the previous decline and reaching Location B at $27,140.
8. Wave C: The pattern suggests that the market is currently heading towards Location C, which aligns with a support level at $26,810. This wave represents the final leg of the corrective pattern. This is a strong level of support but could possibly be broken due to a lack of trading volume during the weekend.
Stay vigilant and monitor the price action closely to see if the pattern continues to unfold as anticipated. Remember to manage your risk effectively and set appropriate stop-loss orders.
交易结束:到达目标
That went well
免责声明
这些信息和出版物并非旨在提供,也不构成TradingView提供或认可的任何形式的财务、投资、交易或其他类型的建议或推荐。请阅读使用条款了解更多信息。
免责声明
这些信息和出版物并非旨在提供,也不构成TradingView提供或认可的任何形式的财务、投资、交易或其他类型的建议或推荐。请阅读使用条款了解更多信息。