
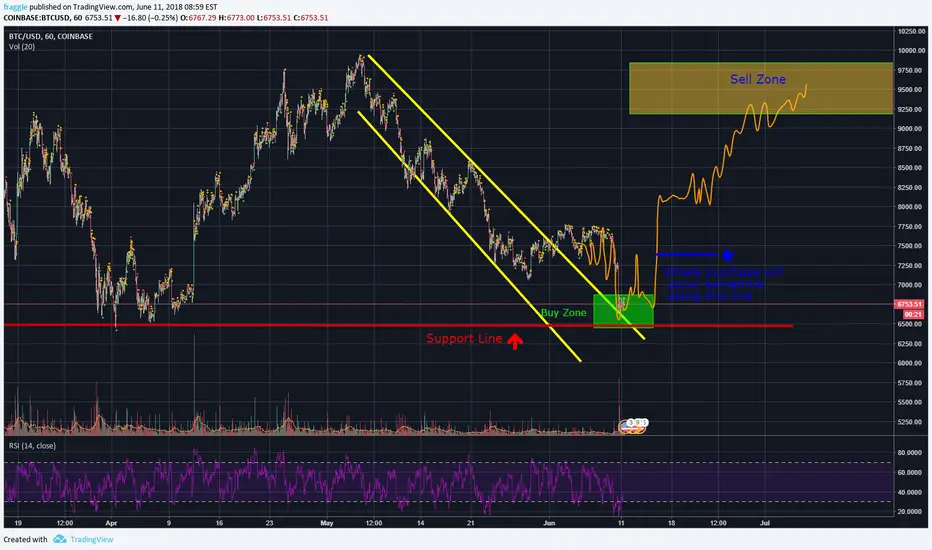
From my previous chart Here:  You can see on the CURRENT chart at top BTC is bouncing off the down trend line as support.
-Time-frame of previous chart moved to the right to match when the drop occured
-Bought in the 6600's HODLing until $9k ish
-Look for BTC to bounce off the trend line again then a whale purchase will occur
-Time-frame of previous chart moved to the right to match when the drop occured
-Bought in the 6600's HODLing until $9k ish
-Look for BTC to bounce off the trend line again then a whale purchase will occur

免责声明
这些信息和出版物并非旨在提供,也不构成TradingView提供或认可的任何形式的财务、投资、交易或其他类型的建议或推荐。请阅读使用条款了解更多信息。