
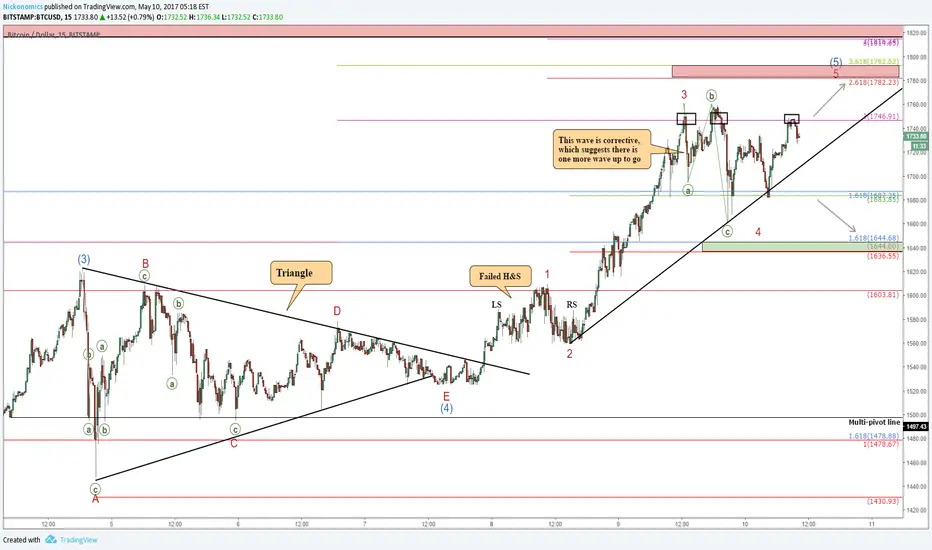
The "Alternative wave count" from my previous update has become viable. The A-B-C structure of the last swing down suggests the price should make another high before attempting a deeper correction. At the same time, currect pullback may be more complex with prices moving down to $1640 area. Important price levels and suport/resistance zones are drawn on the chart.
注释
New high is in place, just as predicted. Watch this pitchfork channel: 注释
The price has hit the $1792 target. As long as it stays within the pitchfork, we don't have a clear sell signal:
相关出版物
免责声明
这些信息和出版物并非旨在提供,也不构成TradingView提供或认可的任何形式的财务、投资、交易或其他类型的建议或推荐。请阅读使用条款了解更多信息。