
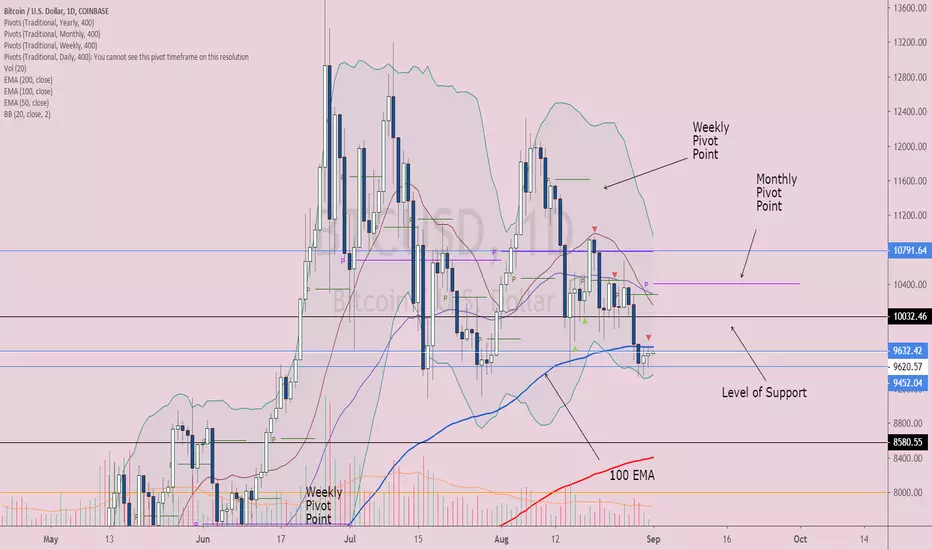
The market is showing signs of a possible bullish reversal of the current downward trend. The volume in the market isn’t supporting further downward motion and prices looks like it’s going to rebound.
Looking at candlestick patterns on the daily chart we have tweezer bottoms and a spinning top formations that are both reversal patterns.If we add in the Bollinger Band indicator we see that we are near the bottom of the band and there is not enough volume to allow for a further breakout in price below.
Next price actions that would validate a bullish reversal would be for the daily to close above the 100 EMA followed by closing above 10,000 and then being able to break through and close above a band of resistance from 10,000 to 10,400 taking out the new monthly pivot point.
Looking at candlestick patterns on the daily chart we have tweezer bottoms and a spinning top formations that are both reversal patterns.If we add in the Bollinger Band indicator we see that we are near the bottom of the band and there is not enough volume to allow for a further breakout in price below.
Next price actions that would validate a bullish reversal would be for the daily to close above the 100 EMA followed by closing above 10,000 and then being able to break through and close above a band of resistance from 10,000 to 10,400 taking out the new monthly pivot point.

免责声明
这些信息和出版物并非旨在提供,也不构成TradingView提供或认可的任何形式的财务、投资、交易或其他类型的建议或推荐。请阅读使用条款了解更多信息。
免责声明
这些信息和出版物并非旨在提供,也不构成TradingView提供或认可的任何形式的财务、投资、交易或其他类型的建议或推荐。请阅读使用条款了解更多信息。