
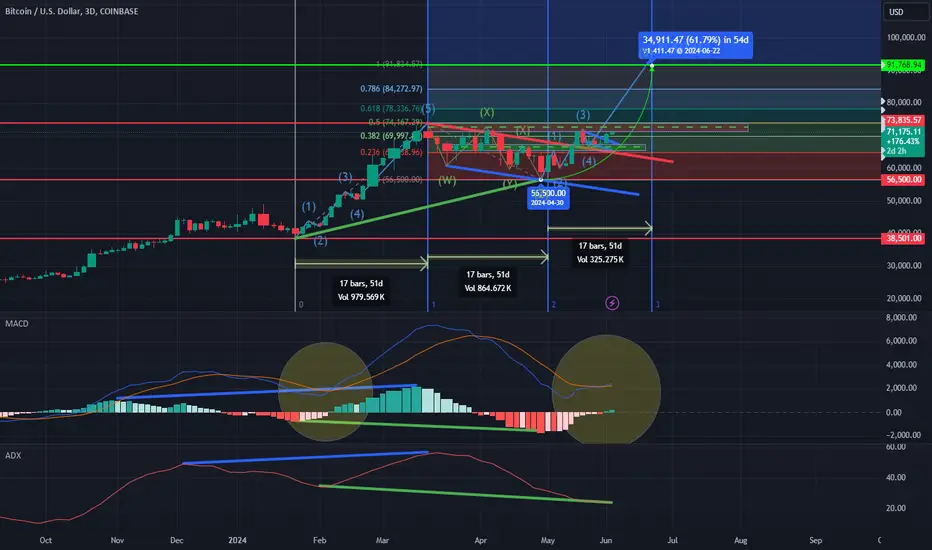
Bitcoin is currently $71,200, and is encountering resistance between $71,180 and $74,000.
I used the Fib Time Zone tool, in combination with Elliot Waves to further clarify the beginning and the end of a bullish or a bearish trend. Coincidently, the time it took for the last two wave to play out was exactly the same (17 days). Bitcoin is in an uptrend at the moment, and as shown on my chart, recently broke above a downwards sloping trendline (Red) -retested it and confirmed as support.
The MACD indicator turned bullish after the retest of the trend-line.
I believe that bitcoins price will continue to rise, as it completes the 5th Elliot impulsive wave. If the price can break above $74,200, I predict a new high between $84,250 and $91,750. If Bitcoin is rejected at $74,200, a retest of $65,000 would be likely.
注释
Also, There was a hidden bullish divergence on both the MACD, and ADX indicators. This shows that the current trend is supported by the underlying momentum.
免责声明
这些信息和出版物并非旨在提供,也不构成TradingView提供或认可的任何形式的财务、投资、交易或其他类型的建议或推荐。请阅读使用条款了解更多信息。
免责声明
这些信息和出版物并非旨在提供,也不构成TradingView提供或认可的任何形式的财务、投资、交易或其他类型的建议或推荐。请阅读使用条款了解更多信息。