
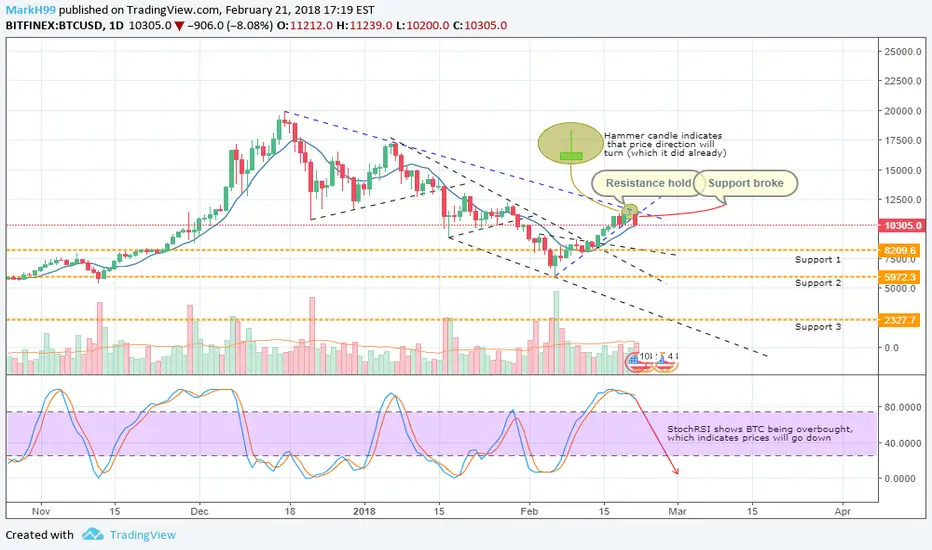
Almost all cryptocurrencies are giving us red numbers. Pure analytically; could we've seen this coming? Actually, the answer is yes. After the reverse head and shoulder (see previous post) and an ascending price line BTC has touched the descending trend resistance line again. This together with an overbought StochRSI (1 day time frame), a very nice hammer shaped candle and a negative market sentiment made it very easy to predict BTC (and therefore the entire market) to decrease again.
The trick is now to predict when the price is going to turn around once again. I have marked 3 support lines in orange which I will be keeping an eye on. These support lines are based on previous support/resistance lines together with Fibonnaci (which I've removed out of this chart because it would make it look like a mess).
Please comment what you think and follow me for more BTC/crypto predictions.
The trick is now to predict when the price is going to turn around once again. I have marked 3 support lines in orange which I will be keeping an eye on. These support lines are based on previous support/resistance lines together with Fibonnaci (which I've removed out of this chart because it would make it look like a mess).
Please comment what you think and follow me for more BTC/crypto predictions.
注释
Updated my support lines. In the next couple of days we'll be testing the 8900usd level. I think btc is very likely to bounce of this line, which we'll mean we will be looking for a bullish trend again.
注释
Although I was waiting for the 8900usd level, it looks like btc turned around earlier than that. As we speak it is testing the downtrend line. I'm pretty confident that it will break this line since btc's strength is backed by a reverse head and shoulders.
Also, I feel like the market sentiment is becoming more positive which is great.
注释
My previous resistance line was a bit of, but here you can see clearly that it hasn'y been broken yet. I'm waiting for btc to touch the resistance line and then we'll see what happens next.
注释
I'm pretty positive that we wil see a retracement on the short term. However, the question is what btc will do after that, will it break the support and continue the downtrend or will it breakout of the downtrend by rocketing trough the resistance line. Only time will tell.
注释
Looks like btc bounced of the resistance line once again. So now we look where the retracement will go. I have combined the short term support line with the support line that is backed by several (highlighted) points. These lines cross near $10k, this is the retracement I'm looking for.
交易结束:到达目标
Since we broke out of the downtrend resistance line I think it is time to close this post and open a new one.
免责声明
这些信息和出版物并非旨在提供,也不构成TradingView提供或认可的任何形式的财务、投资、交易或其他类型的建议或推荐。请阅读使用条款了解更多信息。