
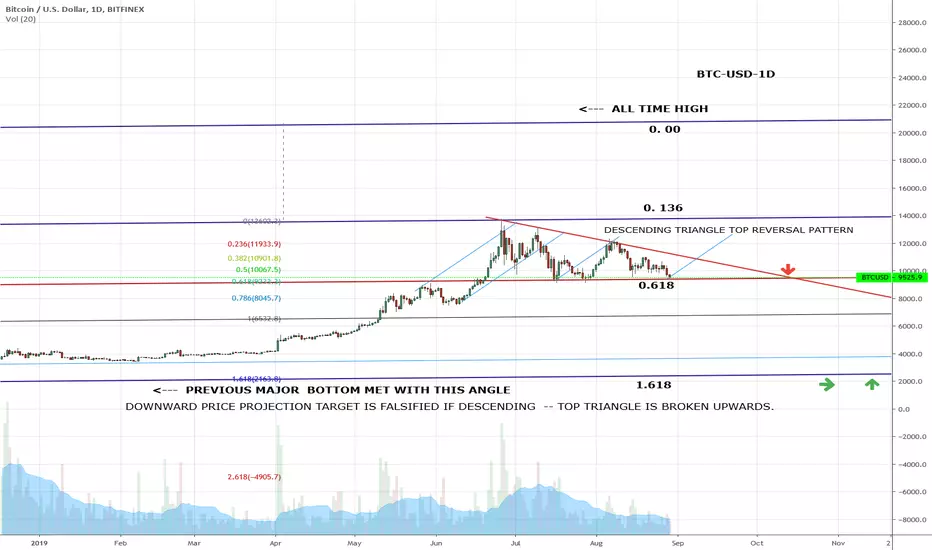
The slightly rising trendlines used in price projection are estimates of the dominating angle where price reacts most to these trendlines.
Descending triangles can be also top or bottom trend reversal patterns.
In this triangle price projection is made from all time high to 0.1360 projection distance.
The almost horizontal bottom of the triangle is at 0.618 projection level -- and the price projection down is at the 1.618 level.
That level meets major previous bottom with the lowest parallel trendline .
Price reactions at 0.786 and 1.00 projection levels should be confirmations of that the trendlines angle is correct.
If price breaks upwards from the triangle -- the price projections down are falsified.
Descending triangles can be also top or bottom trend reversal patterns.
In this triangle price projection is made from all time high to 0.1360 projection distance.
The almost horizontal bottom of the triangle is at 0.618 projection level -- and the price projection down is at the 1.618 level.
That level meets major previous bottom with the lowest parallel trendline .
Price reactions at 0.786 and 1.00 projection levels should be confirmations of that the trendlines angle is correct.
If price breaks upwards from the triangle -- the price projections down are falsified.
注释
Now the price is at breakup or dropdown level
免责声明
这些信息和出版物并非旨在提供,也不构成TradingView提供或认可的任何形式的财务、投资、交易或其他类型的建议或推荐。请阅读使用条款了解更多信息。