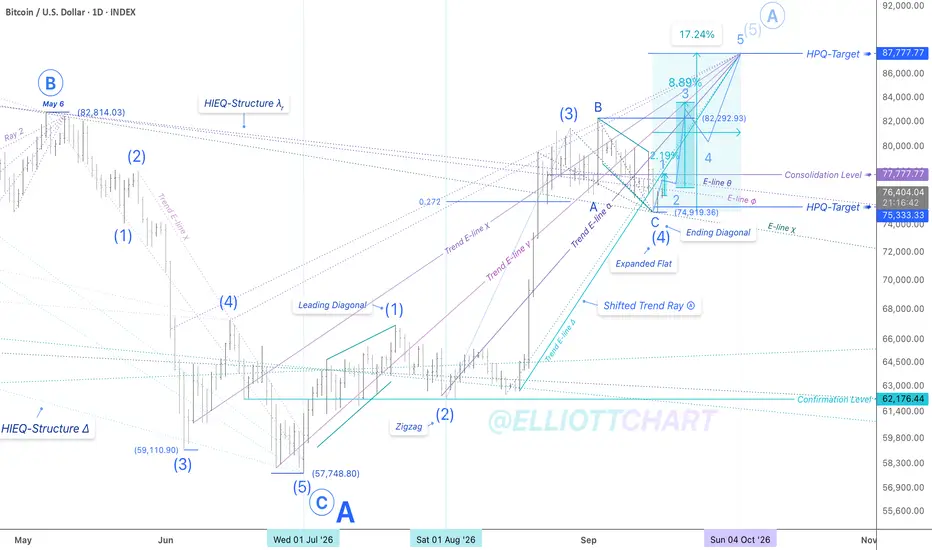
 BTC — HIEQ Model
Just Observation | Where Are We Now on the BTC TS Map?
Preserving $74.9K, identified as the extreme low of Intermediate Wave (4), BTC is now challenging the defined E-line φ of HIEQ-Structure λᵣ.
As previously outlined, potential surges through Minor Impulsive Waves 1 and 3 of Intermediate Wave (5) have been depicted on the chart, respecting the high-probability interactions with the converging resistance zone of the Trend Ray Advance Ⓐ.
The HPQ Target ➤ $87.7K 🎯 remains projected for early October.
#StrategicAnalysis #QuantumEntanglement #CymaticTrendflow #FutureVision #TimeSpaceMap

免责声明
这些信息和出版物并非旨在提供,也不构成TradingView提供或认可的任何形式的财务、投资、交易或其他类型的建议或推荐。请阅读使用条款了解更多信息。