
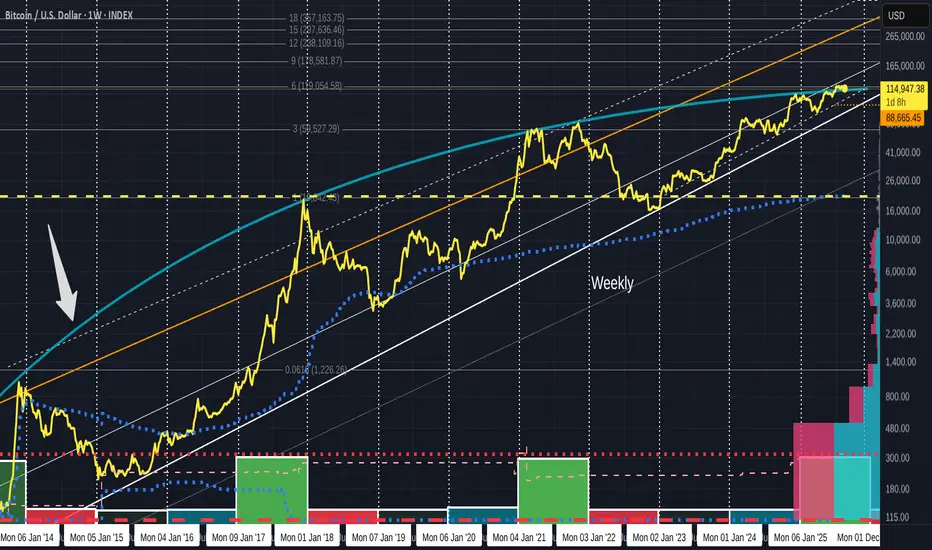
To recap, that Blue Arc that has rejected Bitcoin PA ever since it rose into the Channel.
The Arrow points towards it.
This is the ONLY line that has rejected EVERY ATH since 2013 and is a part of a calculated Fibonacci Spiral.
I have posted the details and shown this in another post.
SO, as you can See, PA has begun getting squeezed by this and the long term rising line of support below. PA has never dropped below this line since rising over it in 2012.
The Crunch point of this squeeze is in December this year.
And PA recentlyt broke ABOVE this Arc in July and has been battling to remain above ever since.
The Daily chart below shows this cearly.
As with anytime that PA rises above resostance, it needs to test it as support and THIS has to be Crucial...We Drop back bellow thisline, PA could get dragged backwards, down, as the spiral descends....
We have tested thisperfectly now, twice -- but we are not clear of trouble yet and as you can see n the daily, PA is currently under the POC ( Red Dots )
The Point of Control (POC) on the Volume Profile Visible Range (VPVR) indicator is the specific price level within the visible range that has recorded the highest volume of trading activity during the selected time period.
This is local resistance
We need to break Free and Rise above this but we may not see that till September

Nothing to be taken as Financial advice.
I will always say
"Only invest what you can afford to loose. When you are ready, take out your original investment. This way, it is only your profit that is at risk"
THAT is Financial advice
I will always say
"Only invest what you can afford to loose. When you are ready, take out your original investment. This way, it is only your profit that is at risk"
THAT is Financial advice
免责声明
这些信息和出版物并非旨在提供,也不构成TradingView提供或认可的任何形式的财务、投资、交易或其他类型的建议或推荐。请阅读使用条款了解更多信息。
Nothing to be taken as Financial advice.
I will always say
"Only invest what you can afford to loose. When you are ready, take out your original investment. This way, it is only your profit that is at risk"
THAT is Financial advice
I will always say
"Only invest what you can afford to loose. When you are ready, take out your original investment. This way, it is only your profit that is at risk"
THAT is Financial advice
免责声明
这些信息和出版物并非旨在提供,也不构成TradingView提供或认可的任何形式的财务、投资、交易或其他类型的建议或推荐。请阅读使用条款了解更多信息。