
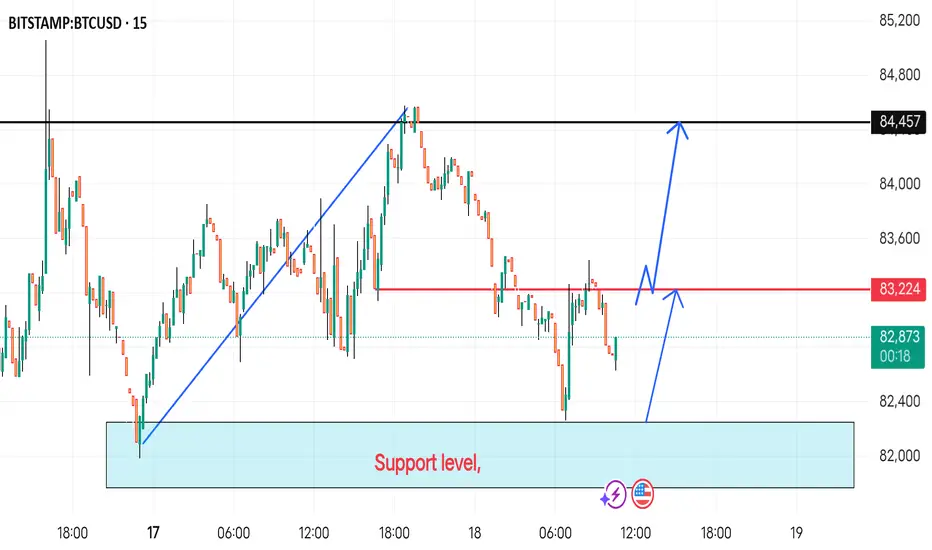
This BTC/USD chart shows a possible bullish setup based on support and resistance levels:
Support Zone (~82,000): The blue highlighted area represents a key support level where buyers might step in.
Resistance Levels:
83,224 (Red Line): A potential resistance level where price might react.
84,457 (Black Line): A stronger resistance level and the ultimate upside target.
Expected Scenarios (Blue Arrows):
1. Bounce from Support → Break 83,224 → Rally to 84,457.
2. Rejection at 83,224 → Retest Support → Second attempt at a breakout.
This suggests that if BTC holds above support, a bullish move is likely. If it fails, a retest of the support zone could happen.
Support Zone (~82,000): The blue highlighted area represents a key support level where buyers might step in.
Resistance Levels:
83,224 (Red Line): A potential resistance level where price might react.
84,457 (Black Line): A stronger resistance level and the ultimate upside target.
Expected Scenarios (Blue Arrows):
1. Bounce from Support → Break 83,224 → Rally to 84,457.
2. Rejection at 83,224 → Retest Support → Second attempt at a breakout.
This suggests that if BTC holds above support, a bullish move is likely. If it fails, a retest of the support zone could happen.

免责声明
这些信息和出版物并非旨在提供,也不构成TradingView提供或认可的任何形式的财务、投资、交易或其他类型的建议或推荐。请阅读使用条款了解更多信息。
免责声明
这些信息和出版物并非旨在提供,也不构成TradingView提供或认可的任何形式的财务、投资、交易或其他类型的建议或推荐。请阅读使用条款了解更多信息。