
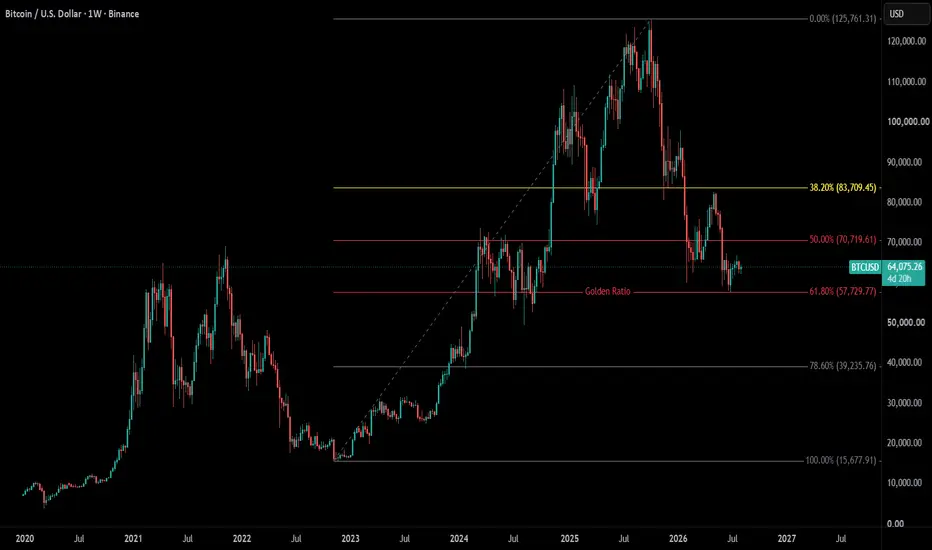
Since we just discussed the Trend-Based Fibonacci Extension tool, let’s look at its much more famous cousin: the Fibonacci Retracement tool.
While extensions project future targets, retracements measure past pullbacks. It is one of the most widely used technical indicators in the world, and it is the first Fibonacci tool most traders learn.
How It Works
The Fibonacci Retracement tool is based on the idea that financial markets often retrace a predictable percentage of a prior move before continuing in the original direction.
You draw the tool by identifying two distinct points on a price chart:
Point 0 (Swing Low): The start of a significant upward move.
Point 1 (Swing High): The end of that upward move.
(For a downtrend, you simply reverse these points—starting from the high and drawing down to the low).
Once you connect these two points, the tool automatically draws horizontal lines at the key Fibonacci ratios between them: 23.6%, 38.2%, 50%, 61.8%, and 78.6%.
The most important level is the 61.8% (often called the "Golden Ratio"). The 50% level is also heavily watched, though mathematically it is not a true Fibonacci number—it is included because it is a major psychological pivot point.
How Traders Use It in Practice
Retracements are primarily used for finding entry points in a trending market. The core strategy is: "The trend is your friend, so buy the dip (or sell the rally)."
Identifying Entry Zones: In an uptrend, instead of buying at the very top, traders wait for the price to pull back to a Fibonacci level (like 38.2% or 61.8%) and look for a bounce to enter a long position.
Placing Stop-Losses: The tool is excellent for risk management. Traders often place their stop-loss orders just below the 78.6% or 100% (the original starting point). If the price retraces beyond these levels, it suggests the overall trend may be failing.
Dynamic Confluence: A retracement level becomes much more powerful if it overlaps with a major moving average (like the 50-day or 200-day MA), a previous support/resistance zone, or a bullish/bearish candlestick pattern.
The "Self-Fulfilling" Prophecy and Institutional Use
Just like the extension tool, institutions use retracements—but again, not in isolation.
Self-Fulfilling Nature: Because so many traders and algorithmic systems watch these exact levels (61.8% and 38.2% especially), they often act as self-fulfilling prophecies. Large institutions know that retail stop-losses and limit-orders are clustered around these zones, making them ideal places for them to execute large buy/sell orders without moving the market too much.
Order Flow Confirmation: Institutional traders will watch a Fibonacci retracement level, but they will not enter a trade just because the price touches it. Instead, they wait for "confirmation"—such as a surge in trading volume, a reversal candlestick pattern (like a hammer or engulfing pattern), or a shift in the order book—to prove that buyers/sellers are actually defending that level before committing capital.
Critical Limitations to Remember
Highly Subjective: Where you start and end your swing points dramatically changes the entire tool. Two traders looking at the same chart can draw completely different levels. (Most professionals recommend using the most obvious swing high/low on a higher timeframe, like the daily or weekly chart, to reduce subjectivity).
Not a Floor or Ceiling: Price does not have to stop at 61.8%. In strong trends, pullbacks may only reach 23.6% before resuming. In weak trends, price will blow straight through 61.8% and retrace 100% (completely reversing).
Use With Trends Only: This tool is virtually useless in a sideways, choppy market. It is strictly designed for assets that are clearly trending up or down.
While extensions project future targets, retracements measure past pullbacks. It is one of the most widely used technical indicators in the world, and it is the first Fibonacci tool most traders learn.
How It Works
The Fibonacci Retracement tool is based on the idea that financial markets often retrace a predictable percentage of a prior move before continuing in the original direction.
You draw the tool by identifying two distinct points on a price chart:
Point 0 (Swing Low): The start of a significant upward move.
Point 1 (Swing High): The end of that upward move.
(For a downtrend, you simply reverse these points—starting from the high and drawing down to the low).
Once you connect these two points, the tool automatically draws horizontal lines at the key Fibonacci ratios between them: 23.6%, 38.2%, 50%, 61.8%, and 78.6%.
The most important level is the 61.8% (often called the "Golden Ratio"). The 50% level is also heavily watched, though mathematically it is not a true Fibonacci number—it is included because it is a major psychological pivot point.
How Traders Use It in Practice
Retracements are primarily used for finding entry points in a trending market. The core strategy is: "The trend is your friend, so buy the dip (or sell the rally)."
Identifying Entry Zones: In an uptrend, instead of buying at the very top, traders wait for the price to pull back to a Fibonacci level (like 38.2% or 61.8%) and look for a bounce to enter a long position.
Placing Stop-Losses: The tool is excellent for risk management. Traders often place their stop-loss orders just below the 78.6% or 100% (the original starting point). If the price retraces beyond these levels, it suggests the overall trend may be failing.
Dynamic Confluence: A retracement level becomes much more powerful if it overlaps with a major moving average (like the 50-day or 200-day MA), a previous support/resistance zone, or a bullish/bearish candlestick pattern.
The "Self-Fulfilling" Prophecy and Institutional Use
Just like the extension tool, institutions use retracements—but again, not in isolation.
Self-Fulfilling Nature: Because so many traders and algorithmic systems watch these exact levels (61.8% and 38.2% especially), they often act as self-fulfilling prophecies. Large institutions know that retail stop-losses and limit-orders are clustered around these zones, making them ideal places for them to execute large buy/sell orders without moving the market too much.
Order Flow Confirmation: Institutional traders will watch a Fibonacci retracement level, but they will not enter a trade just because the price touches it. Instead, they wait for "confirmation"—such as a surge in trading volume, a reversal candlestick pattern (like a hammer or engulfing pattern), or a shift in the order book—to prove that buyers/sellers are actually defending that level before committing capital.
Critical Limitations to Remember
Highly Subjective: Where you start and end your swing points dramatically changes the entire tool. Two traders looking at the same chart can draw completely different levels. (Most professionals recommend using the most obvious swing high/low on a higher timeframe, like the daily or weekly chart, to reduce subjectivity).
Not a Floor or Ceiling: Price does not have to stop at 61.8%. In strong trends, pullbacks may only reach 23.6% before resuming. In weak trends, price will blow straight through 61.8% and retrace 100% (completely reversing).
Use With Trends Only: This tool is virtually useless in a sideways, choppy market. It is strictly designed for assets that are clearly trending up or down.

免责声明
这些信息和出版物并非旨在提供,也不构成TradingView提供或认可的任何形式的财务、投资、交易或其他类型的建议或推荐。请阅读使用条款了解更多信息。
免责声明
这些信息和出版物并非旨在提供,也不构成TradingView提供或认可的任何形式的财务、投资、交易或其他类型的建议或推荐。请阅读使用条款了解更多信息。