
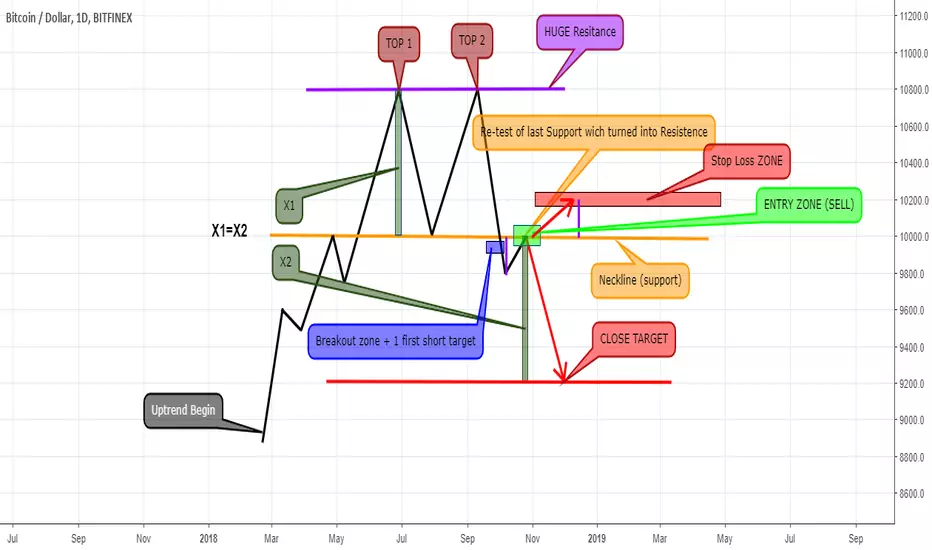
Double top is a reversal chart pattern which means the actually uptrend will be changed to bearish.In this chart pattern we see consecutive double price peaks
This patern occurs at the top of an massive uptrend.After reaching a high like 44-60 weeks high(for exemple) the price is moving to make another higher high but in this second peak bulls slowly will lost their confidence and also volume is still low
The bearish chart pattern is confirmed when the price breaks down below the low point of through
Often traders is started sell-off which will result into a huge red volume candle and also a short term coin-capitalization
Top of these peaks wll be turned into a huge long term resistance
This patern occurs at the top of an massive uptrend.After reaching a high like 44-60 weeks high(for exemple) the price is moving to make another higher high but in this second peak bulls slowly will lost their confidence and also volume is still low
The bearish chart pattern is confirmed when the price breaks down below the low point of through
Often traders is started sell-off which will result into a huge red volume candle and also a short term coin-capitalization
Top of these peaks wll be turned into a huge long term resistance

免责声明
这些信息和出版物并非旨在提供,也不构成TradingView提供或认可的任何形式的财务、投资、交易或其他类型的建议或推荐。请阅读使用条款了解更多信息。
免责声明
这些信息和出版物并非旨在提供,也不构成TradingView提供或认可的任何形式的财务、投资、交易或其他类型的建议或推荐。请阅读使用条款了解更多信息。