
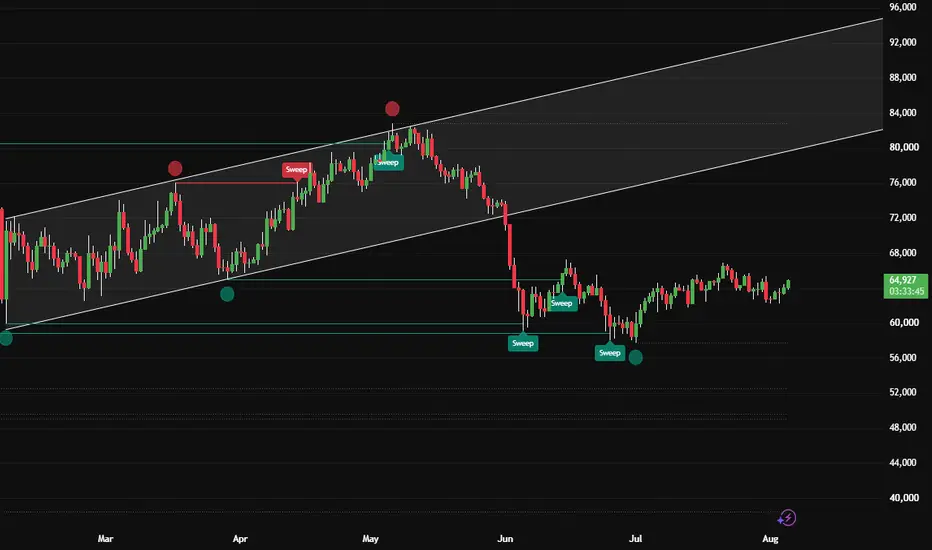
A liquidity sweep is one of the cleanest tells in price action, and most traders miss it because they're watching the close instead of the wick.
Here's the anatomy:
1. A swing high or low forms. Stops build up on the other side of it - buy stops above the high, sell stops below the low.
2. Price pushes past that level. The wick takes out the stops.
3. Price closes back inside the range.
That third step is the whole thing. If price breaks a level and closes beyond it, that's a breakout. If it breaks the level and closes back inside, the move was about collecting liquidity, not about direction.
On this chart you can see it marked: the level gets swept, price reverses, and the move that follows runs in the opposite direction of the "breakout."
What this doesn't tell you: where to enter, where your stop goes, or whether the reversal holds. A sweep is context, not a signal. It tells you what just happened to the order flow - the trade plan is still on you.
Worth noting: the more obvious the level, the more stops sit behind it. Equal highs, round numbers, and previous day's high/low are the levels that get swept most often.
Here's the anatomy:
1. A swing high or low forms. Stops build up on the other side of it - buy stops above the high, sell stops below the low.
2. Price pushes past that level. The wick takes out the stops.
3. Price closes back inside the range.
That third step is the whole thing. If price breaks a level and closes beyond it, that's a breakout. If it breaks the level and closes back inside, the move was about collecting liquidity, not about direction.
On this chart you can see it marked: the level gets swept, price reverses, and the move that follows runs in the opposite direction of the "breakout."
What this doesn't tell you: where to enter, where your stop goes, or whether the reversal holds. A sweep is context, not a signal. It tells you what just happened to the order flow - the trade plan is still on you.
Worth noting: the more obvious the level, the more stops sit behind it. Equal highs, round numbers, and previous day's high/low are the levels that get swept most often.

Pine Script developer & trader. I build clean indicators - Smart Money Concepts, scanners, risk tools. ITAtradingtools.com
免责声明
这些信息和出版物并非旨在提供,也不构成TradingView提供或认可的任何形式的财务、投资、交易或其他类型的建议或推荐。请阅读使用条款了解更多信息。
Pine Script developer & trader. I build clean indicators - Smart Money Concepts, scanners, risk tools. ITAtradingtools.com
免责声明
这些信息和出版物并非旨在提供,也不构成TradingView提供或认可的任何形式的财务、投资、交易或其他类型的建议或推荐。请阅读使用条款了解更多信息。