
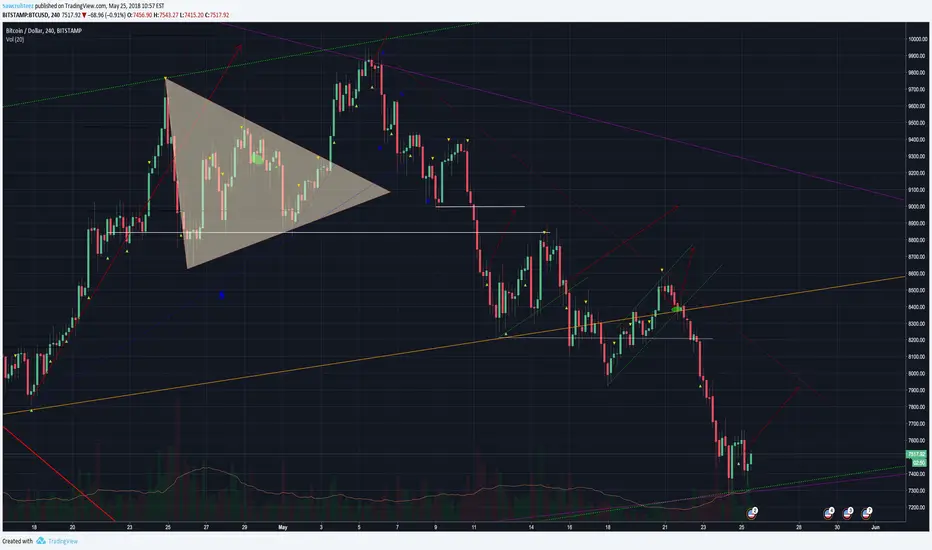
Over the past couple of days we have been dancing on the longer term bull trend line (green dotted). We got a bounce from $7,250 that was short lived. Resistance at $7,650 sent us back down for a retest of the bull trend line.
I do not believe that we are in danger of breaking down through that area of support just yet. We are still in oversold conditions from the pullback on May 22nd and are highly likely to bounce for a retest of the downtrend that started on May 6th (red dotted). The daily chart has not been so far below the 12 & 26 EMA's since April 1st and that points toward a reversion to the mean over the next couple days.
Nevertheless I am remaining on the sidelines until the triangle breaks that started forming Feb 6th. Longing here does provide a very favorable risk:reward, however I have gotten burned too much by being a bull as of late and am content to wait for further confirmation.
Happy trading and go bulls!
A like, comment and follow a day keeps the bears completely away!
I do not believe that we are in danger of breaking down through that area of support just yet. We are still in oversold conditions from the pullback on May 22nd and are highly likely to bounce for a retest of the downtrend that started on May 6th (red dotted). The daily chart has not been so far below the 12 & 26 EMA's since April 1st and that points toward a reversion to the mean over the next couple days.
Nevertheless I am remaining on the sidelines until the triangle breaks that started forming Feb 6th. Longing here does provide a very favorable risk:reward, however I have gotten burned too much by being a bull as of late and am content to wait for further confirmation.
Happy trading and go bulls!
A like, comment and follow a day keeps the bears completely away!

emasar Indicator is available for purchase at alphanalysis.io/product/emasar/
免责声明
这些信息和出版物并非旨在提供,也不构成TradingView提供或认可的任何形式的财务、投资、交易或其他类型的建议或推荐。请阅读使用条款了解更多信息。
emasar Indicator is available for purchase at alphanalysis.io/product/emasar/
免责声明
这些信息和出版物并非旨在提供,也不构成TradingView提供或认可的任何形式的财务、投资、交易或其他类型的建议或推荐。请阅读使用条款了解更多信息。