
Hello, welcome to this BITCOIN /USD update by CRYPTO SANDERS.
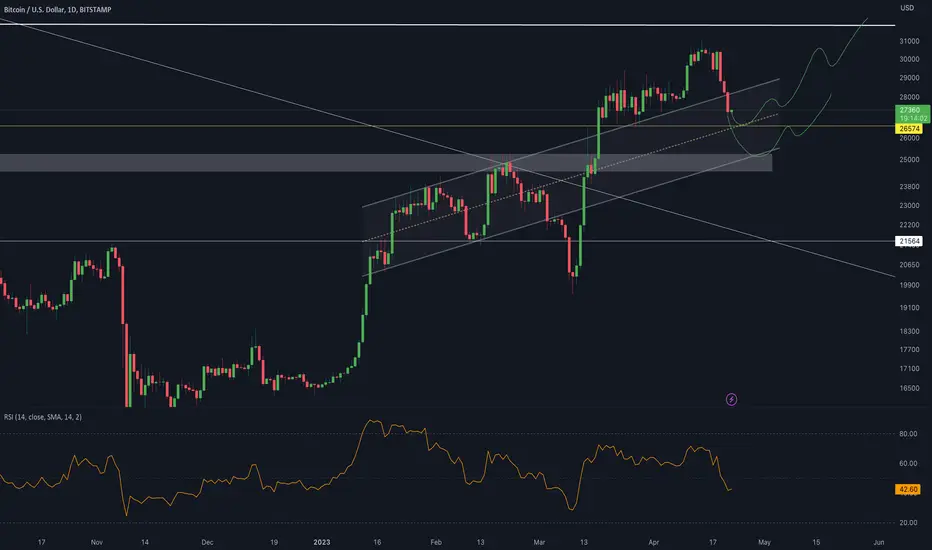
CHART ANALYSIS:- Bitcoin (BTC) moved lower for a third consecutive session on Friday, as prices slipped below the 28,000 mark.
Following a high of 28,906.25 on Thursday, BTC/USD dropped to an intraday low of 27,855.96 earlier in the day.
As a result of this move, bitcoin fell to its weakest point since April 9, which was the last time price hit a floor of 27,800.
Since nearing this point, BTC bulls have reentered the market, and have pushed prices back above 28,000.
One of the catalysts for today’s drop came as the 14-day relative strength index (RSI) fell to a floor of its own at 46.00.
The index has marginally risen from this low and is tracking at 46.35 when writing.
I have tried to bring the best possible outcome to this chart.
Hit the like button if you like it and share your charts in the comments section.
Thank you.
CHART ANALYSIS:- Bitcoin (BTC) moved lower for a third consecutive session on Friday, as prices slipped below the 28,000 mark.
Following a high of 28,906.25 on Thursday, BTC/USD dropped to an intraday low of 27,855.96 earlier in the day.
As a result of this move, bitcoin fell to its weakest point since April 9, which was the last time price hit a floor of 27,800.
Since nearing this point, BTC bulls have reentered the market, and have pushed prices back above 28,000.
One of the catalysts for today’s drop came as the 14-day relative strength index (RSI) fell to a floor of its own at 46.00.
The index has marginally risen from this low and is tracking at 46.35 when writing.
I have tried to bring the best possible outcome to this chart.
Hit the like button if you like it and share your charts in the comments section.
Thank you.

相关出版物
免责声明
这些信息和出版物并非旨在提供,也不构成TradingView提供或认可的任何形式的财务、投资、交易或其他类型的建议或推荐。请阅读使用条款了解更多信息。