
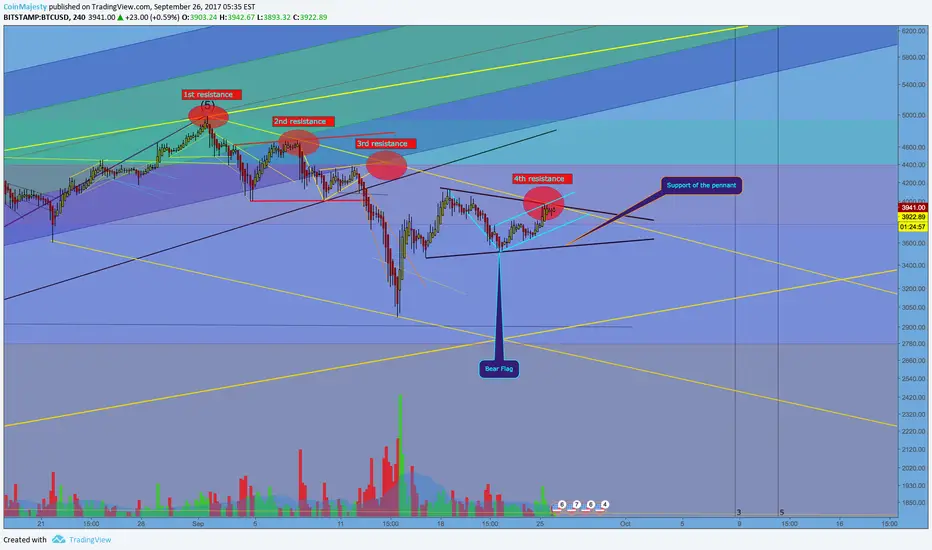
After reaching ATH almost at 5000 USD and at FIB 4.764 (when measured 1 = 1150 and 0 = 150 from the last 2013 bubble and retracement), Bitcoin is currently within a downtrend channel facing 4 strong resistances. Hard to break them but if we look to the details of the other patterns, it's interesting how dissimilar they are. BTCUSD is currently within a small bear flag. At the same time, this bear flag is within a pennant, which could possibly be bullish. My guess is, if BTC breaks down the bear flag and bounces of the lower support of the triangle, it might gain some momentum and break the four resistance levels it has been dealing with inside of that channel since ATH. If this happens, we could see BTC going first to 4400 and then attempting to go again to ATH.
Nevertheless, BTC is also within a wider and longer rising channel that got its shape since the first trimester of the current year. If this channel breaks down (as usually rising channels do), expect a massive dump. There is also a possibility that BTC will bounce on the lower support level of this channel and then attempt to reach ATH, although I find it less likely. Not totally diminishing it though.

Nevertheless, BTC is also within a wider and longer rising channel that got its shape since the first trimester of the current year. If this channel breaks down (as usually rising channels do), expect a massive dump. There is also a possibility that BTC will bounce on the lower support level of this channel and then attempt to reach ATH, although I find it less likely. Not totally diminishing it though.

免责声明
这些信息和出版物并非旨在提供,也不构成TradingView提供或认可的任何形式的财务、投资、交易或其他类型的建议或推荐。请阅读使用条款了解更多信息。
免责声明
这些信息和出版物并非旨在提供,也不构成TradingView提供或认可的任何形式的财务、投资、交易或其他类型的建议或推荐。请阅读使用条款了解更多信息。