
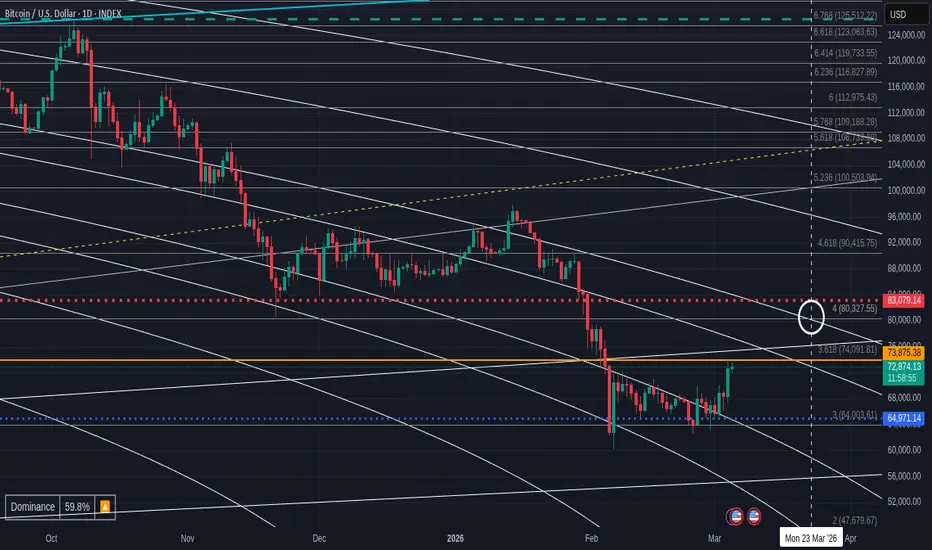
This post is done with the assumption that Bitcoin Bulls want to post a GREEN March Candle CLose, possibly before a further Drop back down. We will have to see what happens IF we get there.
The main chart above , a Linear chart, shows the Expected target around 80K on the 4 Fib Extension. That also intersects a Fib circle that if we look back along it, has acted as Both resistance and support previously. It is a Valid line and this intersection is in the Last week of March.
The second chart shows us a Similar idea.
This also invloves the 4 Fib Extension line. The other line is the strong rejection trend line that has been rejecting PA since October 2024.
The intersection in this chart, a Log chart, is also in the last week of March , at a price area of 82K
The 3rd chart is another Log chart
The target circle is slightly higher on this and we have 2 possible intersections, again in the last week of March, early April. ( I look to the March part for that Green candle close )
The Horizontal line intersects that Red 236 Fib circle around 85K -> 87K
The Lower ascending line has been used as support a few times in Bitcoin History
This intersects at 82K
Previous rejections were firm.
But what is it that has Made me look att he 80K price range ?
The VWAP Chart.
To Remind you, Volume IS KEY to understanding PA.
VWAP (Volume Weighted Average Price) is a technical analysis indicator that calculates the average price of a security traded over a specific period—typically a single trading day—weighted by the volume of trades at each price level. Unlike a simple average, VWAP gives more importance to prices where higher trading volume occurred, providing a more accurate representation of where the market has actually transacted
This is the VWAP from the last 2 cycle Lows
The VWAP line is Arrowed on both occasions
The Red lines above are multiples of that VWAP line, 1, 2 and 3
See how they act as support / Rejecton.
So now we zoom into the current area
And we see the VWAP line has been supporting PA and now, PA has pushed higher.
Providing PA makes it through the lines of resistance, we can see that the REAL resistance lays in this 80K to 85K Range, and right in the middle of that range is this red Multiple of the current VWAP line., 82K
It has acted as strong support previously ( Circled )
CONCLUSOIN
Very simply, this all depends on Bitcoin being able to walk through the lines of resistance above. I have little doubt the Bulls can do this but the question is When.
After 5 consecutive months of Red, a Green March woudl restore some confidence and while we See Gold slowing down, the money may Move over.
But just be aware, that price may tumble also. We are in Danerous times
Bitcoin just as easily roll over and tumble.....58K is still also a target at some point

Nothing to be taken as Financial advice.
I will always say
"Only invest what you can afford to loose. When you are ready, take out your original investment. This way, it is only your profit that is at risk"
THAT is Financial advice
I will always say
"Only invest what you can afford to loose. When you are ready, take out your original investment. This way, it is only your profit that is at risk"
THAT is Financial advice
免责声明
这些信息和出版物并非旨在提供,也不构成TradingView提供或认可的任何形式的财务、投资、交易或其他类型的建议或推荐。请阅读使用条款了解更多信息。
Nothing to be taken as Financial advice.
I will always say
"Only invest what you can afford to loose. When you are ready, take out your original investment. This way, it is only your profit that is at risk"
THAT is Financial advice
I will always say
"Only invest what you can afford to loose. When you are ready, take out your original investment. This way, it is only your profit that is at risk"
THAT is Financial advice
免责声明
这些信息和出版物并非旨在提供,也不构成TradingView提供或认可的任何形式的财务、投资、交易或其他类型的建议或推荐。请阅读使用条款了解更多信息。