
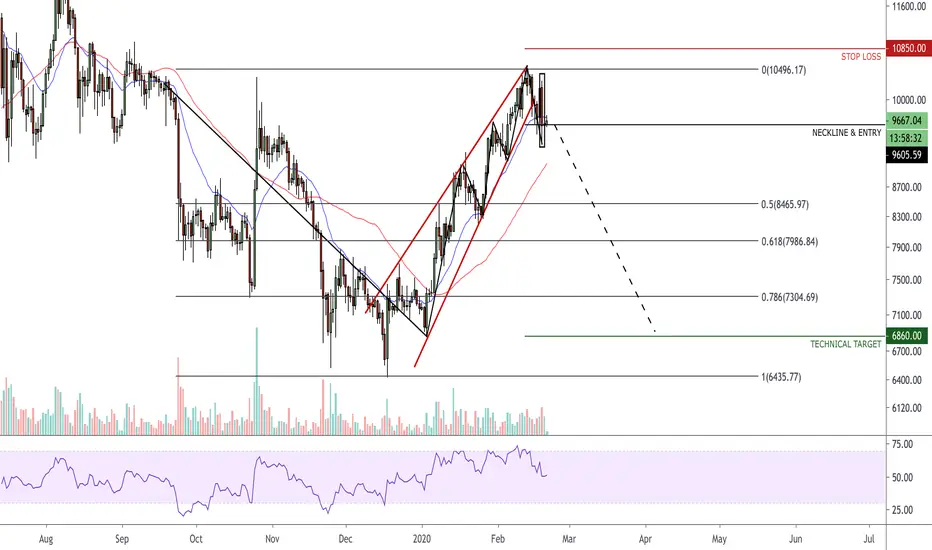
Hello friends! After a prior strong downtrend of six months, the price of Bitcoin (BTCUSD) printed a Rising Wedge pattern. This pattern was formed by higher highs combined with small pullbacks during this seven-weeks trend. Smaller pullbacks usually underline the strength of a trend. What's suspicious here is that the we see a divergence with the volume, which was declining while the price was rising. Buyers did not support the higher price levels. This finally resulted in a rejection at $10.500 with a move to $9.200 within 6 days. The Support Line of the Rising Wedge broke.
Indicators go crazy on this volatility - but most of them point bearish now. The price is moving below the EMA 20, which is an inherent part of my strategy when trading Bitcoin.
I use the Rising Wedge pattern to verify my
Since we do have a major event upcoming in May (Halving), i will hedge here while adding more longs at the Fibonacci Retracement Levels (0.5, 0.618, 0.786).
Please manage your risk properly! If you have any questions, feel free to contact me. All details are in the bottom of the description.
cheers,
cryptobuller
___
Disclaimer: Any opinions, chats, messages, news, research, analyses, prices, or other information contained in this Idea are provided as general market information for educational and entertainment purposes only
Indicators go crazy on this volatility - but most of them point bearish now. The price is moving below the EMA 20, which is an inherent part of my strategy when trading Bitcoin.
I use the Rising Wedge pattern to verify my
- Stop-Loss slightly above the peak
- Neckline & Entry at today's open price
- Technical Target at the bottom of the Wedge
Since we do have a major event upcoming in May (Halving), i will hedge here while adding more longs at the Fibonacci Retracement Levels (0.5, 0.618, 0.786).
Please manage your risk properly! If you have any questions, feel free to contact me. All details are in the bottom of the description.
cheers,
cryptobuller
___
Disclaimer: Any opinions, chats, messages, news, research, analyses, prices, or other information contained in this Idea are provided as general market information for educational and entertainment purposes only
注释
I will wait for neckline to be broken before activating this trade交易开始
交易结束:到达目标

相关出版物
免责声明
这些信息和出版物并非旨在提供,也不构成TradingView提供或认可的任何形式的财务、投资、交易或其他类型的建议或推荐。请阅读使用条款了解更多信息。