
Dear traders:
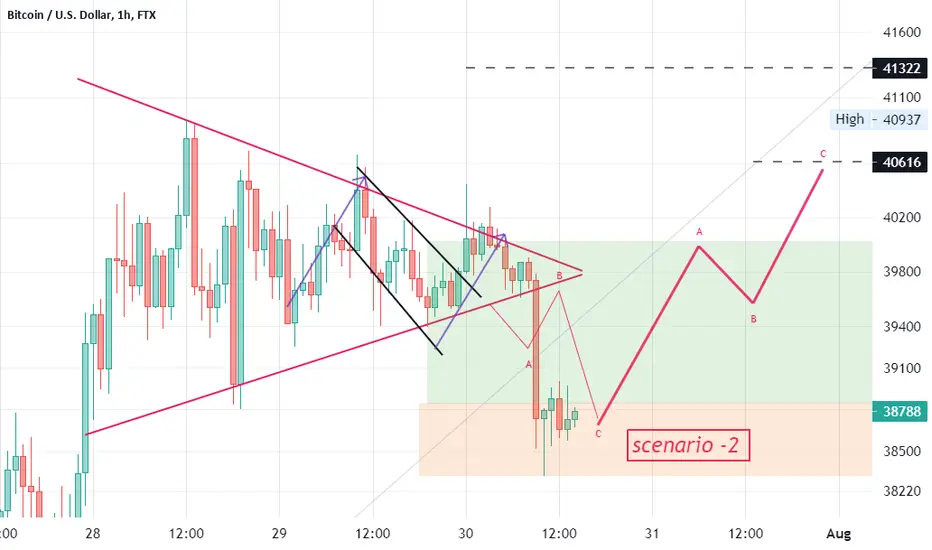
As you see, scenario 2 happened (see attached idea (Symmetrical Triangle)).
Based on the chart, 38333 $ touched. Jul 29 I told you: 38476 $ is (very) strong support (See attached Idea (Graphical idea (My Idea My way))).
Also, Based on DMI, We have a long way for market saturation!
Remember: we are inside a Mega bull flag pattern (Bull flag is the most bullish chart pattern (ever))
注释
注释
注释
注释
注释
注释
注释
注释
注释
41600 $ touched,
免责声明
这些信息和出版物并非旨在提供,也不构成TradingView提供或认可的任何形式的财务、投资、交易或其他类型的建议或推荐。请阅读使用条款了解更多信息。