
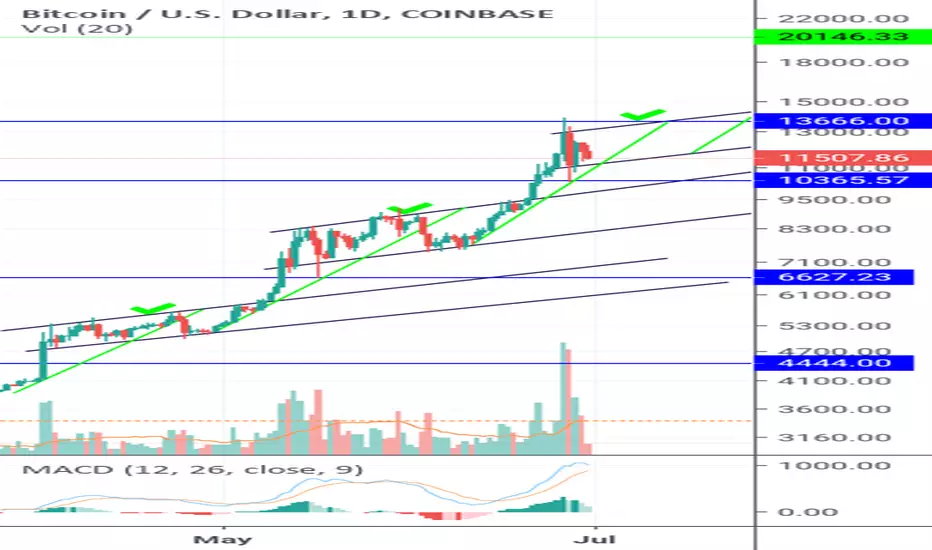
Redid my previous chart for better visuals. Im not a "moonboy" but price action does seem to be following this since capitulation. We're looking at target next of about 20k. 3 waves make a pattern so keep an eye on the bottom support of the current range between 13666 and 11200. 11k should hold and then the 21ema holds. Look at how the 21ema is following my regression line? Look at the previous ones. Now remember, those green regression lines were already plotted before the yellow 21ema then follows. At 20k, we'll see if it forms another wave for higher or what it does. Thanks for reading

免责声明
这些信息和出版物并非旨在提供,也不构成TradingView提供或认可的任何形式的财务、投资、交易或其他类型的建议或推荐。请阅读使用条款了解更多信息。