
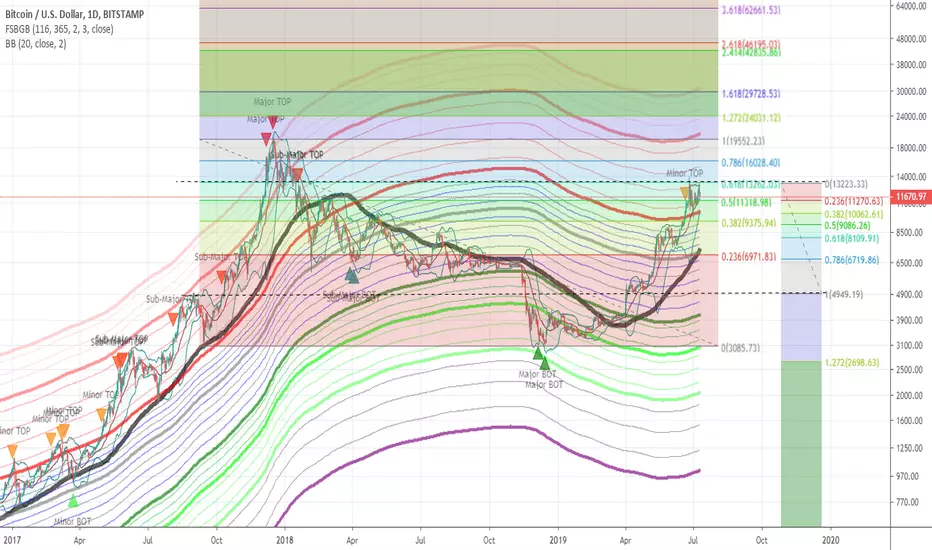
BTC presently expected to double top at 0.618 level of longer-term trend.
Expect BTC to fall back to around 8400 at 0.618 level of shorter-term trend.
Analysis rejected if double top fails, and BTC goes higher beyond and shows strong support above 14k.
See also:
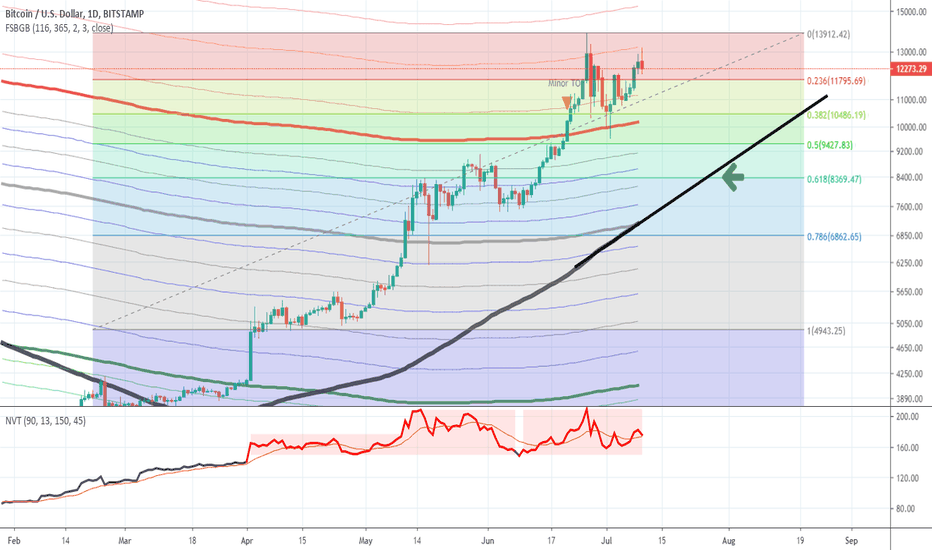
Expect BTC to fall back to around 8400 at 0.618 level of shorter-term trend.
Analysis rejected if double top fails, and BTC goes higher beyond and shows strong support above 14k.
See also:
注释
Explaination: The FSBGB indicator shows that historically, we have presently reached a local top corresponding to the FSBGB-levels where local-tops were logged during the stage of the bull-market from 2016 till April of 2017, before the "red" FSBGB-level was eventually breached.注释
Link to indicator used: tradingview.com/v/N0FyoIlB/
免责声明
这些信息和出版物并非旨在提供,也不构成TradingView提供或认可的任何形式的财务、投资、交易或其他类型的建议或推荐。请阅读使用条款了解更多信息。
免责声明
这些信息和出版物并非旨在提供,也不构成TradingView提供或认可的任何形式的财务、投资、交易或其他类型的建议或推荐。请阅读使用条款了解更多信息。