
Hey everyone,
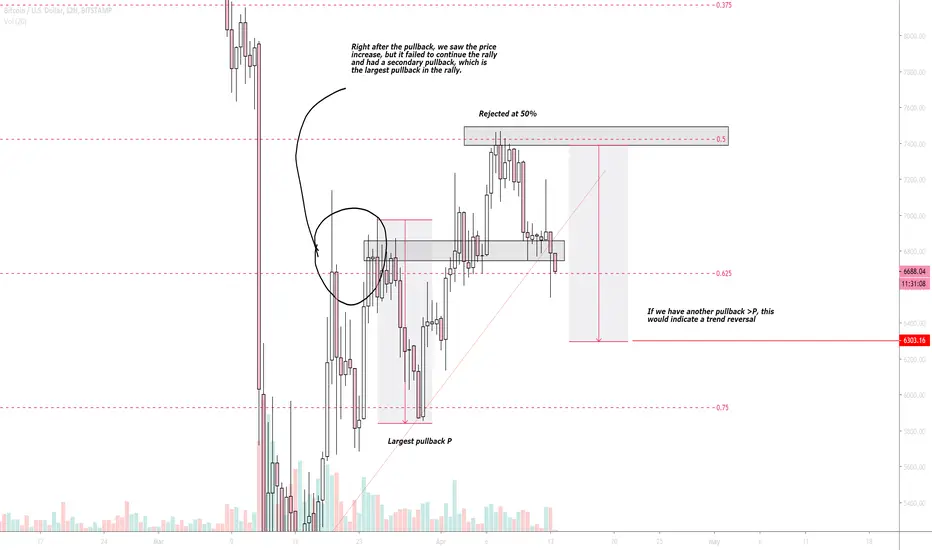
As you can see on the chart, we got rejected at the 50% level, which is one of the most important levels in any trend, and if this current pullback is bigger than the biggest pullback we have had, that could be a sign of a trend reversal.
Right before the rejection, we saw signs of a weak rally, as we pulled back, went back up, but right after we crossed the peak of the last wave, we had a secondary pullback.
There is still a possibility that this is just another pullback and we will break 50% comfortably in the next move, but we can't forget that we've broken the trendline
The levels on the chart are Gann levels, and not Fibonacci
cheers,
tonite
As you can see on the chart, we got rejected at the 50% level, which is one of the most important levels in any trend, and if this current pullback is bigger than the biggest pullback we have had, that could be a sign of a trend reversal.
Right before the rejection, we saw signs of a weak rally, as we pulled back, went back up, but right after we crossed the peak of the last wave, we had a secondary pullback.
There is still a possibility that this is just another pullback and we will break 50% comfortably in the next move, but we can't forget that we've broken the trendline
The levels on the chart are Gann levels, and not Fibonacci
cheers,
tonite

免责声明
这些信息和出版物并非旨在提供,也不构成TradingView提供或认可的任何形式的财务、投资、交易或其他类型的建议或推荐。请阅读使用条款了解更多信息。