
Description:
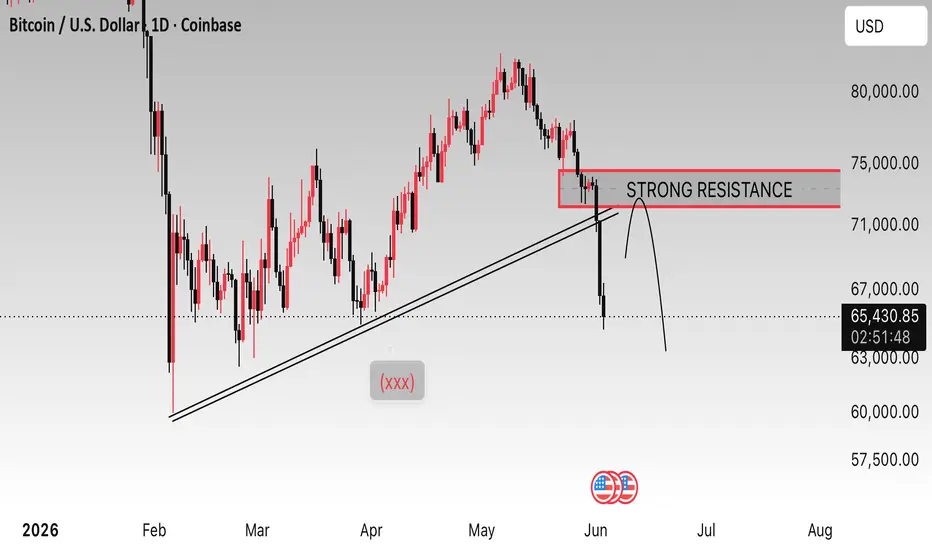
This daily Bitcoin (BTC/USD) chart shows a decisive rejection from a major resistance zone around $72,000–$74,000. Price has broken below a key ascending trendline that previously supported the uptrend, signaling weakening bullish momentum. The highlighted resistance area remains a critical level to watch, and any retest could attract renewed selling pressure. If the breakdown is confirmed, Bitcoin may face further downside toward lower support levels in the coming sessions.
Not financial advice

免责声明
这些信息和出版物并非旨在提供,也不构成TradingView提供或认可的任何形式的财务、投资、交易或其他类型的建议或推荐。请阅读使用条款了解更多信息。