
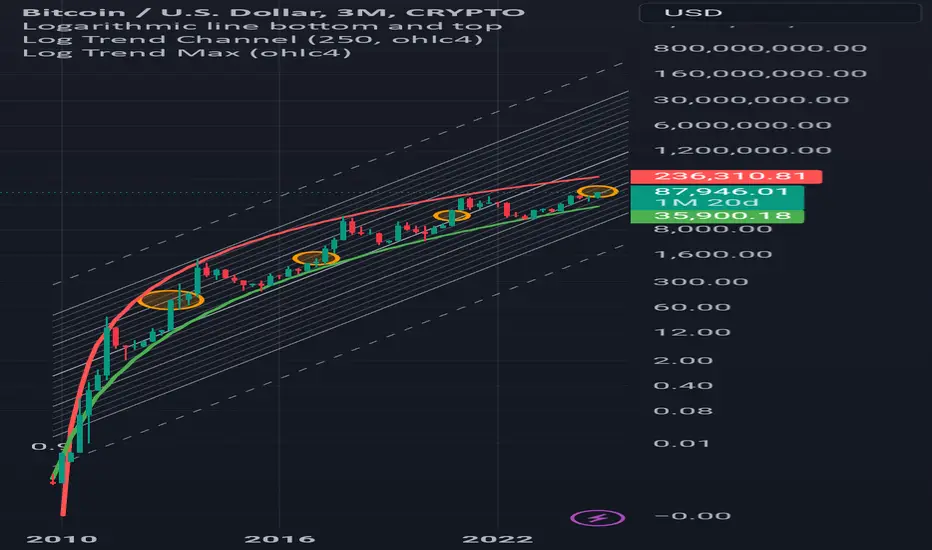
the quarterly chart in logarithmic price shows the cyclical arrangement of bull market breaks to new all time highs on the curve. the current bull market has the typical shape of each other breakout in the time cycles along a logarithmic pattern. shown are the logarithmic trend max and channel. this indicates a move inside the curve. during these periods btcusd tends to gain 80% over 3-6 months. im remaining buy sided btcusd for the foreseeable future targeting $124k by april 2025, stop loss as low as $59k.

免责声明
这些信息和出版物并非旨在提供,也不构成TradingView提供或认可的任何形式的财务、投资、交易或其他类型的建议或推荐。请阅读使用条款了解更多信息。