
 BTCUSDT.P
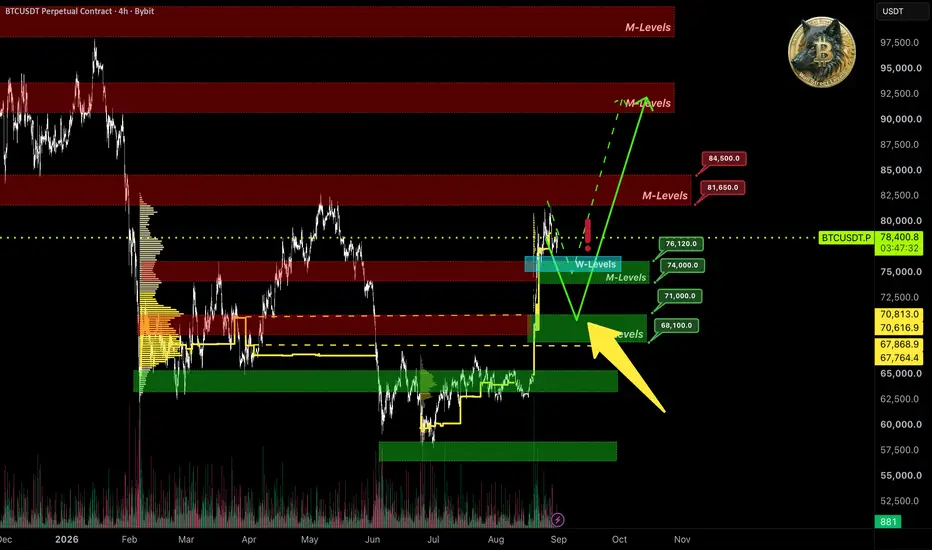
As seen on the chart, price continues trading between monthly 📊M-Levels, showing no clear direction.
🧩IMA data shows that after the bounce from resistance, 🐋large players partially took profits on their longs. Meanwhile, capital outflow from the spot market continued.
The shortened Sunday 🇺🇸US session didn't give a clear signal on market sentiment. Right now, it's important to see what the full Monday session shows.
Judging by 🐋large players' behavior, the monthly support at 📊M-Levels $74000–$76000 is highly likely to get broken. In that case, we can expect price to drop into the $68000–$70000 area, which lines up with the volume level.
If the idea was useful — glad to have your support 🚀.
📊M-Levels — institutional interest levels.
🧩IMA — Integrated Market Analysis
⚠️ Closed algorithms don't show on the chart. Only key levels are displayed.

More trading signals in my channel: t.me/well_street_levels
相关出版物
免责声明
这些信息和出版物并非旨在提供,也不构成TradingView提供或认可的任何形式的财务、投资、交易或其他类型的建议或推荐。请阅读使用条款了解更多信息。
More trading signals in my channel: t.me/well_street_levels
相关出版物
免责声明
这些信息和出版物并非旨在提供,也不构成TradingView提供或认可的任何形式的财务、投资、交易或其他类型的建议或推荐。请阅读使用条款了解更多信息。