
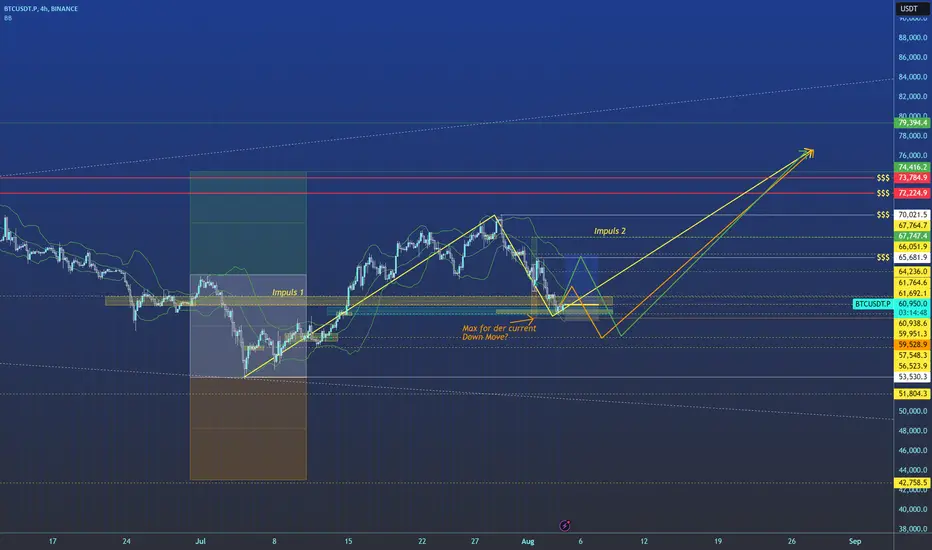
Bitcoin is creeping lower and a downtrend appears to be establishing itself in the medium term.
But I still think about all-time highs this year. However, I don't currently want to forecast the low before the all-time high.
Last week was difficult for long positions. I was stopped out on trailing with small profits and also had a losing trade.
I also think that the swing low will remain in the area of 53300 on a daily basis and that Bitcoin will take liquidity again for a further price drop for the actual weakness that exists in the market.
The big money will get the necessary orders for their shorts.
Such a scenario would be possible if the current price is maintained and a second impulse movement follows. Also marked in the Chart.
The current trade offers a 3R profit in the short term. And should be closed when the double top and the upper Bollinger band are reached (4 H).
Alternatively, for those who are thinking of more upward potential, a gradual scale out and/or trail would be possible on 4 hour swing lows. So the trade could perhaps reach all-time high levels if this was really the low.
You can also currently see that a so-called fair value gap has been filled on a daily basis and the price has reached an old value zone.
My mapping for the current downward movement shown by the orange box also suggests that the current downward move could be over. So lets see....good trades!
But I still think about all-time highs this year. However, I don't currently want to forecast the low before the all-time high.
Last week was difficult for long positions. I was stopped out on trailing with small profits and also had a losing trade.
I also think that the swing low will remain in the area of 53300 on a daily basis and that Bitcoin will take liquidity again for a further price drop for the actual weakness that exists in the market.
The big money will get the necessary orders for their shorts.
Such a scenario would be possible if the current price is maintained and a second impulse movement follows. Also marked in the Chart.
The current trade offers a 3R profit in the short term. And should be closed when the double top and the upper Bollinger band are reached (4 H).
Alternatively, for those who are thinking of more upward potential, a gradual scale out and/or trail would be possible on 4 hour swing lows. So the trade could perhaps reach all-time high levels if this was really the low.
You can also currently see that a so-called fair value gap has been filled on a daily basis and the price has reached an old value zone.
My mapping for the current downward movement shown by the orange box also suggests that the current downward move could be over. So lets see....good trades!

免责声明
这些信息和出版物并非旨在提供,也不构成TradingView提供或认可的任何形式的财务、投资、交易或其他类型的建议或推荐。请阅读使用条款了解更多信息。