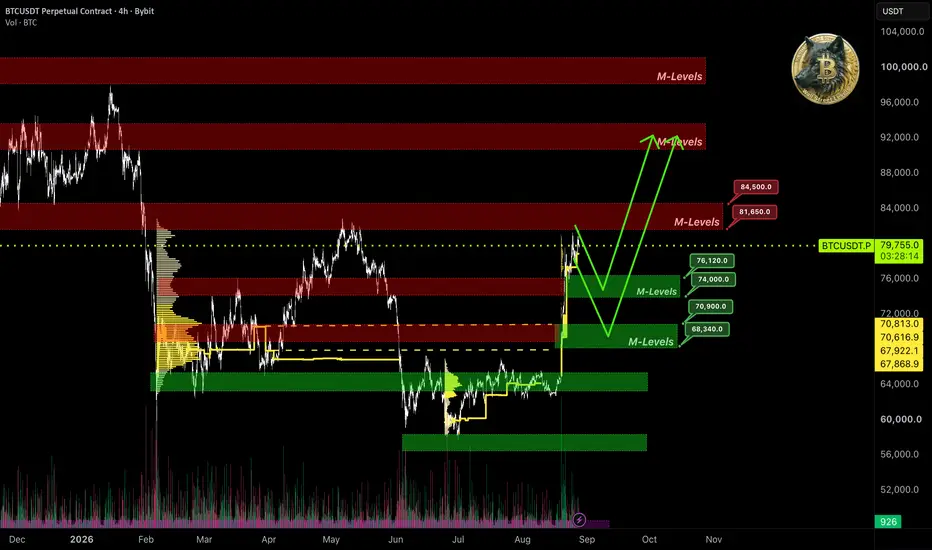
The week of  BTC anomalous run is wrapping up. Time to analyze the chart after support levels got rebuilt.
Right now price is right up against the historically strong monthly resistance 📊M-Levels $81650–$84500, where as 🧩IMA points out, 🐋large players started taking some profits.
Spot market also shows dropping inflows, from this we can conclude that the market took a pause and growth continues without new capital backing it.
A straight-up breakout of monthly resistance and further growth with this data is unlikely, in this setup if 🐋large players' mood stays bullish, a pullback to support levels for a reload looks logical, and only then a resistance breakout.
Chart shows that the nearest monthly support is 📊M-Levels $74000–$76000, where we should expect a reaction from 🐋large players.
Next strong 📊M-Levels $68340–$70900 I consider even more weighty, which is backed by order volume accumulation, a break of this level will break the growth structure, which could again lead to a prolonged flat.
Friends, that's my take on Bitcoin.
If you liked the analysis - support it with a rocket 🚀.
🧩IMA — Integrated Market Analysis
📊M-Levels — Institutional Interest Levels
⚠️ Platform restrictions don't allow publishing closed indicators. I only display the result of the 📊Levels algorithm.
BTC anomalous run is wrapping up. Time to analyze the chart after support levels got rebuilt.Right now price is right up against the historically strong monthly resistance 📊M-Levels $81650–$84500, where as 🧩IMA points out, 🐋large players started taking some profits.
Spot market also shows dropping inflows, from this we can conclude that the market took a pause and growth continues without new capital backing it.
A straight-up breakout of monthly resistance and further growth with this data is unlikely, in this setup if 🐋large players' mood stays bullish, a pullback to support levels for a reload looks logical, and only then a resistance breakout.
Chart shows that the nearest monthly support is 📊M-Levels $74000–$76000, where we should expect a reaction from 🐋large players.
Next strong 📊M-Levels $68340–$70900 I consider even more weighty, which is backed by order volume accumulation, a break of this level will break the growth structure, which could again lead to a prolonged flat.
Friends, that's my take on Bitcoin.
If you liked the analysis - support it with a rocket 🚀.
🧩IMA — Integrated Market Analysis
📊M-Levels — Institutional Interest Levels
⚠️ Platform restrictions don't allow publishing closed indicators. I only display the result of the 📊Levels algorithm.
注释
Judging by 🐋large players' behavior, the monthly support at 📊M-Levels $74000–$76000 is highly likely to get broken. In that case, we can expect price to drop into the $68000–$70000 area, which lines up with the volume level.
More trading signals in my channel: t.me/well_street_levels
相关出版物
免责声明
这些信息和出版物并非旨在提供,也不构成TradingView提供或认可的任何形式的财务、投资、交易或其他类型的建议或推荐。请阅读使用条款了解更多信息。
More trading signals in my channel: t.me/well_street_levels
相关出版物
免责声明
这些信息和出版物并非旨在提供,也不构成TradingView提供或认可的任何形式的财务、投资、交易或其他类型的建议或推荐。请阅读使用条款了解更多信息。