
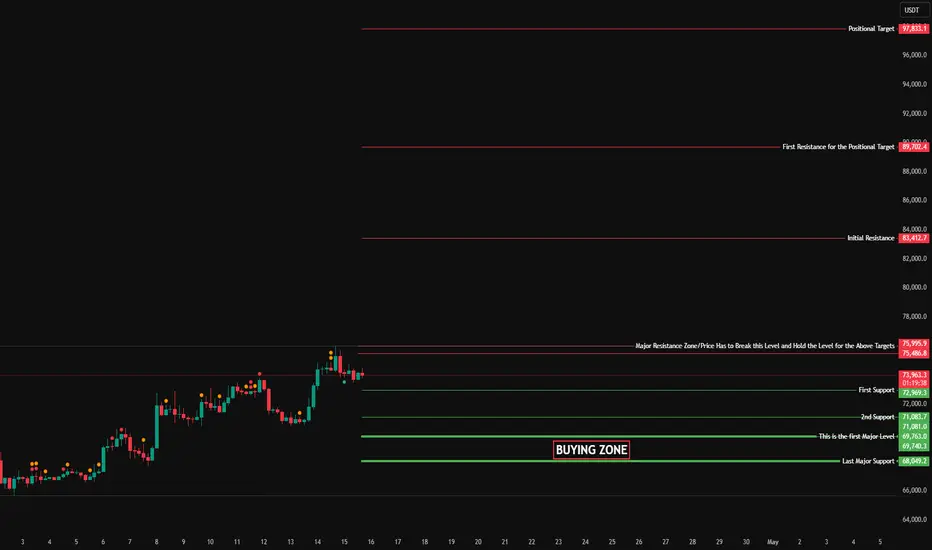
BTC Positional Analysis — Bullish Structure Above Buying Zone with Defined Resistance Path
The market is currently in a higher timeframe bullish structure, showing steady strength after forming a base and pushing upward. Price is now consolidating near the recent highs, indicating absorption rather than weakness, which supports a positional bullish outlook.
The key element in this structure is the Buying Zone (69,763 – 68,049). As long as price continues to hold above this zone, the overall positional bias remains bullish, and the upside targets remain valid.
In the near term, price is facing a major resistance zone around 75,486 – 75,995. This zone is critical because price needs to break and hold above it to unlock further upside. Until that happens, the market may continue to consolidate below resistance.
If price successfully sustains above this resistance zone, the next levels come into play:
Initial Resistance: 83,412
First Resistance for Positional Target: 89,702
Beyond these levels, the positional target at 97,833 becomes achievable, provided the structure continues to hold and resistance levels are cleared with acceptance.
On the downside, 72,969 (1st Support) and 71,083 (2nd Support) act as intermediate supports. However, the real invalidation of the positional bullish view comes only if price breaks and trades below the Buying Zone.
Structural Insight
Market phase: Accumulation → Expansion → Consolidation near highs
Current behavior: Holding strength, not showing reversal
Bias: Positional bullish as long as Buying Zone holds
Conclusion
The structure clearly supports a positional bullish view, but the move toward higher targets is conditional on breaking the major resistance zone.
As long as price remains above the Buying Zone, the positional target of 97,833 remains achievable, with step-by-step resistance acting as checkpoints rather than barriers.
The focus remains on:
Holding the Buying Zone → Maintain bullish bias
Breaking resistance → Confirm continuation
The market is currently in a higher timeframe bullish structure, showing steady strength after forming a base and pushing upward. Price is now consolidating near the recent highs, indicating absorption rather than weakness, which supports a positional bullish outlook.
The key element in this structure is the Buying Zone (69,763 – 68,049). As long as price continues to hold above this zone, the overall positional bias remains bullish, and the upside targets remain valid.
In the near term, price is facing a major resistance zone around 75,486 – 75,995. This zone is critical because price needs to break and hold above it to unlock further upside. Until that happens, the market may continue to consolidate below resistance.
If price successfully sustains above this resistance zone, the next levels come into play:
Initial Resistance: 83,412
First Resistance for Positional Target: 89,702
Beyond these levels, the positional target at 97,833 becomes achievable, provided the structure continues to hold and resistance levels are cleared with acceptance.
On the downside, 72,969 (1st Support) and 71,083 (2nd Support) act as intermediate supports. However, the real invalidation of the positional bullish view comes only if price breaks and trades below the Buying Zone.
Structural Insight
Market phase: Accumulation → Expansion → Consolidation near highs
Current behavior: Holding strength, not showing reversal
Bias: Positional bullish as long as Buying Zone holds
Conclusion
The structure clearly supports a positional bullish view, but the move toward higher targets is conditional on breaking the major resistance zone.
As long as price remains above the Buying Zone, the positional target of 97,833 remains achievable, with step-by-step resistance acting as checkpoints rather than barriers.
The focus remains on:
Holding the Buying Zone → Maintain bullish bias
Breaking resistance → Confirm continuation

免责声明
这些信息和出版物并非旨在提供,也不构成TradingView提供或认可的任何形式的财务、投资、交易或其他类型的建议或推荐。请阅读使用条款了解更多信息。